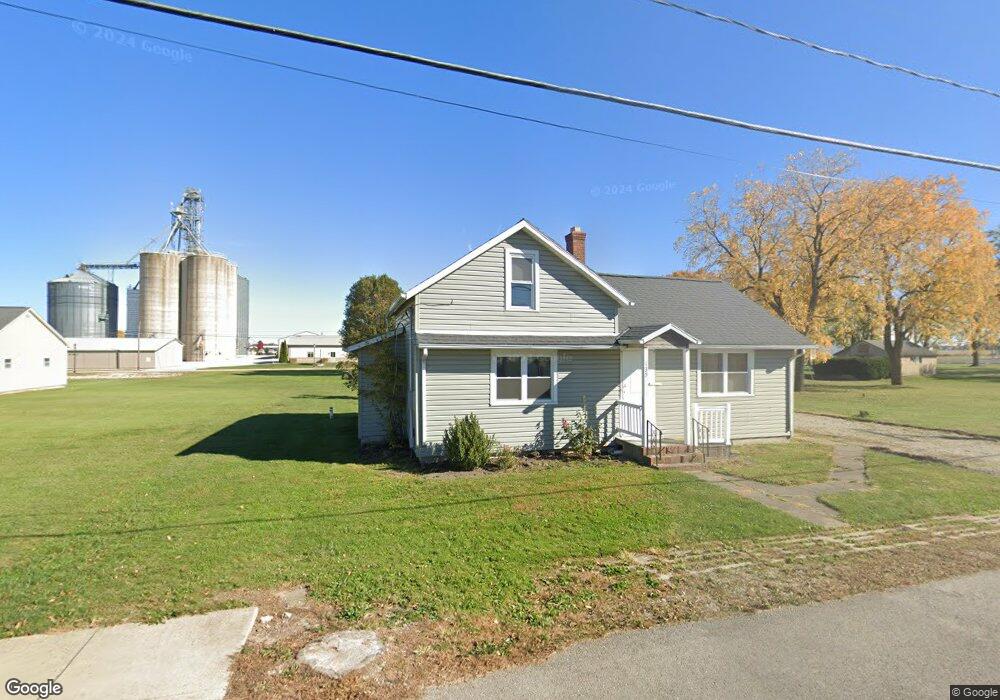
135 Elm St Osgood, OH 45351
Estimated Value: $233,000 - $370,000
3
Beds
1
Bath
1,153
Sq Ft
$265/Sq Ft
Est. Value
About This Home
This home is located at 135 Elm St, Osgood, OH 45351 and is currently estimated at $305,988, approximately $265 per square foot. 135 Elm St is a home with nearby schools including Marion Local Elementary School and Marion Local High School.
Ownership History
Date
Name
Owned For
Owner Type
Purchase Details
Closed on
Mar 23, 2023
Sold by
Werling Michael S and Werling Ashley
Current Estimated Value
Purchase Details
Closed on
Jan 15, 2004
Sold by
Grillot Pond Audrey E and Grillot Audrey E
Bought by
Werling Michael S
Home Financials for this Owner
Home Financials are based on the most recent Mortgage that was taken out on this home.
Original Mortgage
$44,800
Interest Rate
5.91%
Mortgage Type
Purchase Money Mortgage
Purchase Details
Closed on
Apr 1, 1990
Bought by
Werling Michael S
Create a Home Valuation Report for This Property
The Home Valuation Report is an in-depth analysis detailing your home's value as well as a comparison with similar homes in the area
Purchase History
| Date | Buyer | Sale Price | Title Company |
|---|---|---|---|
| -- | -- | -- | |
| Werling Michael S | $40,000 | -- | |
| Werling Michael S | $20,500 | -- |
Source: Public Records
Mortgage History
| Date | Status | Borrower | Loan Amount |
|---|---|---|---|
| Previous Owner | Werling Michael S | $44,800 |
Source: Public Records
Tax History
| Year | Tax Paid | Tax Assessment Tax Assessment Total Assessment is a certain percentage of the fair market value that is determined by local assessors to be the total taxable value of land and additions on the property. | Land | Improvement |
|---|---|---|---|---|
| 2025 | $3,700 | $99,060 | $4,850 | $94,210 |
| 2024 | $3,700 | $99,060 | $4,850 | $94,210 |
| 2023 | $1,080 | $29,560 | $4,850 | $24,710 |
| 2022 | $713 | $19,020 | $4,120 | $14,900 |
| 2021 | $726 | $19,020 | $4,120 | $14,900 |
| 2020 | $728 | $19,020 | $4,120 | $14,900 |
| 2019 | $624 | $16,040 | $4,120 | $11,920 |
| 2018 | $650 | $16,040 | $4,120 | $11,920 |
| 2017 | $716 | $16,040 | $4,120 | $11,920 |
| 2016 | $579 | $14,540 | $4,120 | $10,420 |
| 2015 | $579 | $14,540 | $4,120 | $10,420 |
| 2014 | $579 | $14,540 | $4,120 | $10,420 |
| 2013 | $750 | $13,590 | $4,120 | $9,470 |
Source: Public Records
Map
Nearby Homes
Your Personal Tour Guide
Ask me questions while you tour the home.