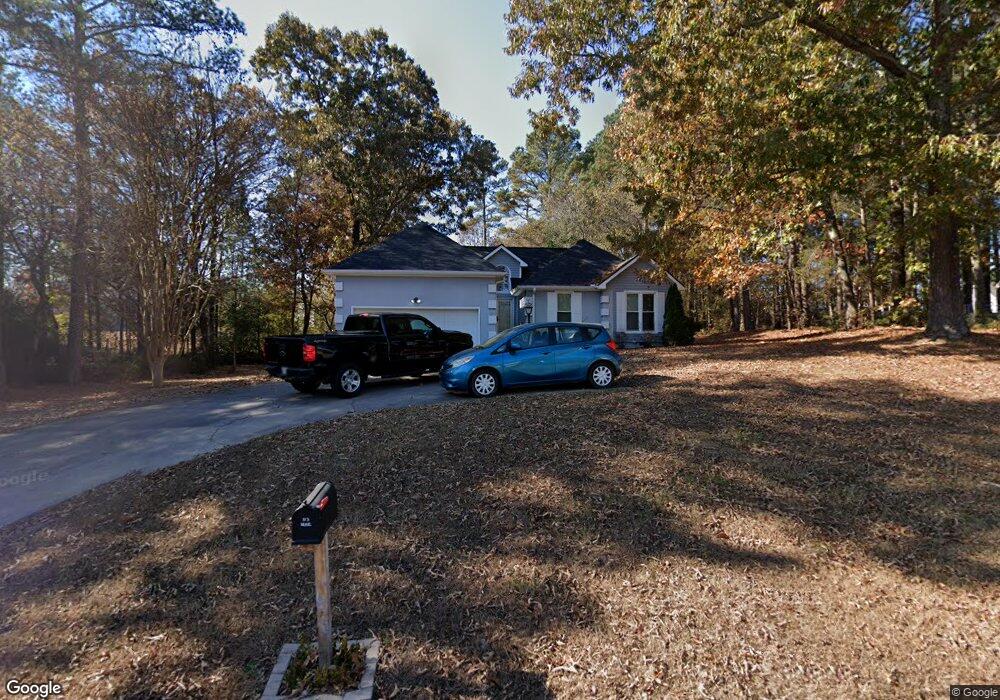
135 Greystone Dr SE Calhoun, GA 30701
Estimated Value: $280,683 - $295,000
3
Beds
2
Baths
1,359
Sq Ft
$211/Sq Ft
Est. Value
About This Home
This home is located at 135 Greystone Dr SE, Calhoun, GA 30701 and is currently estimated at $286,671, approximately $210 per square foot. 135 Greystone Dr SE is a home located in Gordon County with nearby schools including Sonoraville Elementary School, Red Bud Middle School, and Sonoraville High School.
Ownership History
Date
Name
Owned For
Owner Type
Purchase Details
Closed on
Feb 17, 2021
Sold by
Curtis Samuel
Bought by
Dendy Douglas
Current Estimated Value
Home Financials for this Owner
Home Financials are based on the most recent Mortgage that was taken out on this home.
Original Mortgage
$181,649
Outstanding Balance
$162,465
Interest Rate
2.7%
Mortgage Type
FHA
Estimated Equity
$124,206
Purchase Details
Closed on
May 17, 2019
Sold by
Kula Anthony E
Bought by
Curtis Samuel
Home Financials for this Owner
Home Financials are based on the most recent Mortgage that was taken out on this home.
Original Mortgage
$150,522
Interest Rate
4.37%
Mortgage Type
FHA
Purchase Details
Closed on
Aug 31, 1993
Bought by
Kula Cherie E and Kula Anthony E
Purchase Details
Closed on
Mar 19, 1993
Bought by
T Burch Construction
Create a Home Valuation Report for This Property
The Home Valuation Report is an in-depth analysis detailing your home's value as well as a comparison with similar homes in the area
Home Values in the Area
Average Home Value in this Area
Purchase History
| Date | Buyer | Sale Price | Title Company |
|---|---|---|---|
| Dendy Douglas | $185,000 | -- | |
| Curtis Samuel | $153,300 | -- | |
| Kula Cherie E | $74,200 | -- | |
| T Burch Construction | -- | -- |
Source: Public Records
Mortgage History
| Date | Status | Borrower | Loan Amount |
|---|---|---|---|
| Open | Dendy Douglas | $181,649 | |
| Previous Owner | Curtis Samuel | $150,522 |
Source: Public Records
Tax History Compared to Growth
Tax History
| Year | Tax Paid | Tax Assessment Tax Assessment Total Assessment is a certain percentage of the fair market value that is determined by local assessors to be the total taxable value of land and additions on the property. | Land | Improvement |
|---|---|---|---|---|
| 2024 | $2,147 | $84,492 | $6,800 | $77,692 |
| 2023 | $2,011 | $79,140 | $6,800 | $72,340 |
| 2022 | $1,999 | $74,076 | $6,800 | $67,276 |
| 2021 | $1,717 | $61,296 | $6,800 | $54,496 |
| 2020 | $1,739 | $60,712 | $5,600 | $55,112 |
| 2019 | $502 | $54,112 | $5,600 | $48,512 |
| 2018 | $510 | $54,960 | $5,600 | $49,360 |
| 2017 | $494 | $52,240 | $5,600 | $46,640 |
| 2016 | $454 | $48,080 | $5,600 | $42,480 |
| 2015 | $450 | $47,280 | $5,600 | $41,680 |
| 2014 | $424 | $45,502 | $5,600 | $39,902 |
Source: Public Records
Map
Nearby Homes
- 166 Woodford Way SE
- 190 Woodford Way SE
- 145 Water Wheel Ln SE
- 135 Grist Mill Ln SE
- 140 Grist Mill Ln SE
- 311 Langston Rd SE
- 137 Hunters Trail SE
- 157 Asbury Cir
- 172 Hunters Trail SE
- 478 Oakland Dr SE
- 140 Chestnut Ln SE
- Grand Bahama Plan at Heritage Grove - 2-Story
- Anderson Plan at Heritage Grove - 2-Story
- Aruba Bay Plan at Heritage Grove - 2-Story
- Allegheny Plan at Heritage Grove - 2-Story
- Hudson Plan at Heritage Grove - 2-Story
- Eden Cay Plan at Heritage Grove - 2-Story
- Ballenger Plan at Heritage Grove - 2-Story
- The Bradley Plan at Saddle Ridge
- The James Plan at Saddle Ridge
- 123 Greystone Dr SE
- 166 Hanover Cir SE
- 130 Clifton Ct SE
- 124 Greystone Dr SE
- 157 Greystone Dr SE
- 178 Hanover Cir SE
- 142 Greystone Dr SE
- 107 Greystone Dr SE
- 110 Greystone Dr SE
- 156 Hanover Cir SE
- 0 Greystone Dr SE Unit 8120616
- 0 Greystone Dr SE
- 188 Hanover Cir SE
- 120 Clifton Ct SE
- 158 Greystone Dr SE
- 131 Clifton Ct SE
- 131 Clifton Ct SE
- 152 Hanover Cir SE
- 171 Hanover Cir SE
- 171 Greystone Dr SE