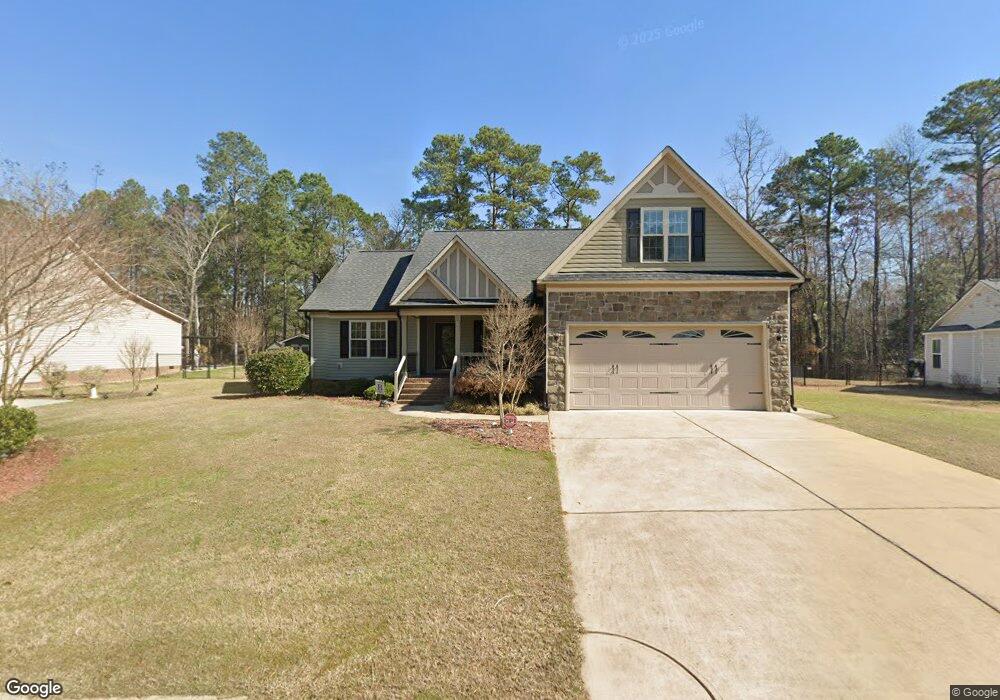
135 Hunterwood Place Unit Lot Benson, NC 27504
Estimated Value: $318,000 - $354,000
3
Beds
2
Baths
2,007
Sq Ft
$167/Sq Ft
Est. Value
About This Home
This home is located at 135 Hunterwood Place Unit Lot, Benson, NC 27504 and is currently estimated at $334,527, approximately $166 per square foot. 135 Hunterwood Place Unit Lot is a home located in Johnston County with nearby schools including Benson Elementary School, Benson Middle School, and South Johnston High School.
Ownership History
Date
Name
Owned For
Owner Type
Purchase Details
Closed on
Dec 15, 2016
Sold by
Mclamb Wood Ronald Corbett and Mclamb Wood Nichole
Bought by
Belt Irvin L and Belt Sarah V
Current Estimated Value
Home Financials for this Owner
Home Financials are based on the most recent Mortgage that was taken out on this home.
Original Mortgage
$152,240
Outstanding Balance
$123,007
Interest Rate
3.54%
Mortgage Type
New Conventional
Estimated Equity
$211,520
Purchase Details
Closed on
Jan 22, 2013
Sold by
Holland Danny Mack and Holland Pam B
Bought by
Wood Ronald Corbett and Wood Nichole Mclamb
Purchase Details
Closed on
Mar 22, 2011
Sold by
Capital Bank
Bought by
Holland Danny Mack and Holland Pam B
Purchase Details
Closed on
Feb 1, 2010
Sold by
Ashley Turner Enterprises Inc
Bought by
Capital Bank
Purchase Details
Closed on
Dec 4, 2008
Sold by
Willa Properties Inc
Bought by
Ashley Turner Enterprises Inc
Create a Home Valuation Report for This Property
The Home Valuation Report is an in-depth analysis detailing your home's value as well as a comparison with similar homes in the area
Home Values in the Area
Average Home Value in this Area
Purchase History
| Date | Buyer | Sale Price | Title Company |
|---|---|---|---|
| Belt Irvin L | $190,500 | None Available | |
| Wood Ronald Corbett | -- | None Available | |
| Holland Danny Mack | $81,000 | None Available | |
| Capital Bank | $88,367 | None Available | |
| Ashley Turner Enterprises Inc | $186,000 | Blackacre Title Ins Agency |
Source: Public Records
Mortgage History
| Date | Status | Borrower | Loan Amount |
|---|---|---|---|
| Open | Belt Irvin L | $152,240 |
Source: Public Records
Tax History Compared to Growth
Tax History
| Year | Tax Paid | Tax Assessment Tax Assessment Total Assessment is a certain percentage of the fair market value that is determined by local assessors to be the total taxable value of land and additions on the property. | Land | Improvement |
|---|---|---|---|---|
| 2025 | $4,108 | $363,500 | $55,000 | $308,500 |
| 2024 | $2,740 | $214,080 | $40,000 | $174,080 |
| 2023 | $2,740 | $214,080 | $40,000 | $174,080 |
| 2022 | $2,740 | $214,080 | $40,000 | $174,080 |
| 2021 | $2,740 | $214,080 | $40,000 | $174,080 |
| 2020 | $2,762 | $214,080 | $40,000 | $174,080 |
| 2019 | $2,762 | $214,080 | $40,000 | $174,080 |
| 2018 | $2,256 | $170,940 | $26,000 | $144,940 |
| 2017 | $2,256 | $170,940 | $26,000 | $144,940 |
| 2016 | $2,239 | $170,940 | $26,000 | $144,940 |
| 2015 | $2,239 | $170,940 | $26,000 | $144,940 |
| 2014 | $2,239 | $170,940 | $26,000 | $144,940 |
Source: Public Records
Map
Nearby Homes
- 124 Hunterwood Place
- 115 Hunterwood Place
- 103 Hunterwood Place
- 0 Gilbert-A Rd Unit 100466573
- 9385 Us 301 Hw
- 9385 U S 301
- 8535 U S 301
- Brooks Plan at Alder Creek
- Winston Plan at Alder Creek
- Finley Plan at Alder Creek
- Watauga Plan at Alder Creek
- McKimmon Plan at Alder Creek
- Clark Plan at Alder Creek
- 166 Tarheel Rd
- 37 Gardenia Ct
- 230 Wendy Place
- 1643 Hannah Creek Rd
- 132 Crystal Place
- 120 Crystal Place
- 294 White Azalea Way
- 135 Hunterwood Place
- 133 Hunterwood Place
- 133 Hunterwood Place Unit Lot # 94
- 131 Hunterwood Place Unit LOT95
- 131 Hunterwood Place
- 139 Hunterwood Place
- 132 Hunterwood Place
- 130 Hunterwood Place
- 129 Hunterwood Place
- 134 Hunterwood Place
- 141 Hunterwood Place
- 128 Hunterwood Place
- 127 Hunterwood Place
- 136 Hunterwood Place
- 126 Hunterwood Place
- 138 Hunterwood Place
- 143 Hunterwood Place
- 10713 Us Highway 301 S
- 10713 S Us 301 Hwy
- 125 Hunterwood Place