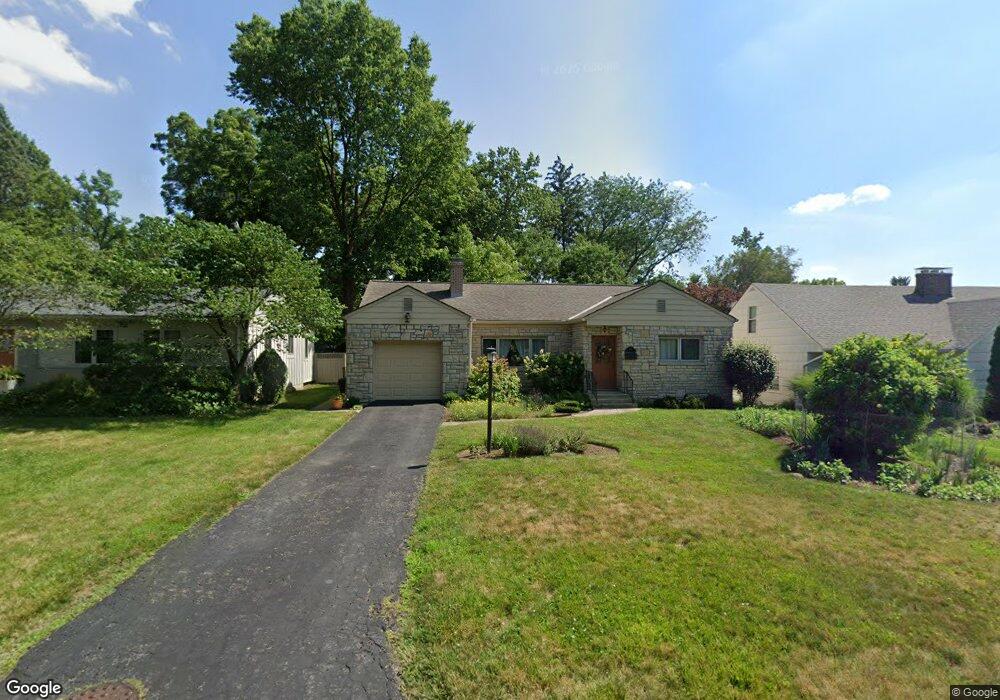
135 Indian Springs Dr Columbus, OH 43214
Clintonville NeighborhoodEstimated Value: $451,000 - $513,000
2
Beds
1
Bath
1,228
Sq Ft
$394/Sq Ft
Est. Value
About This Home
This home is located at 135 Indian Springs Dr, Columbus, OH 43214 and is currently estimated at $483,872, approximately $394 per square foot. 135 Indian Springs Dr is a home located in Franklin County with nearby schools including Indian Springs Elementary School, Dominion Middle School, and Whetstone High School.
Ownership History
Date
Name
Owned For
Owner Type
Purchase Details
Closed on
Jun 10, 2005
Sold by
Campbell Patricia L
Bought by
Moore Sally J
Current Estimated Value
Home Financials for this Owner
Home Financials are based on the most recent Mortgage that was taken out on this home.
Original Mortgage
$170,000
Outstanding Balance
$89,605
Interest Rate
5.91%
Mortgage Type
Fannie Mae Freddie Mac
Estimated Equity
$394,267
Purchase Details
Closed on
Jul 30, 2002
Sold by
Morris Peter L and Morris Wendy L
Bought by
Campbell Patricia L
Purchase Details
Closed on
Apr 17, 1996
Sold by
Corlett Kay A
Bought by
Peter L Morris
Home Financials for this Owner
Home Financials are based on the most recent Mortgage that was taken out on this home.
Original Mortgage
$99,750
Interest Rate
7.44%
Mortgage Type
New Conventional
Purchase Details
Closed on
Oct 19, 1992
Purchase Details
Closed on
Jul 1, 1986
Create a Home Valuation Report for This Property
The Home Valuation Report is an in-depth analysis detailing your home's value as well as a comparison with similar homes in the area
Home Values in the Area
Average Home Value in this Area
Purchase History
| Date | Buyer | Sale Price | Title Company |
|---|---|---|---|
| Moore Sally J | $217,500 | -- | |
| Campbell Patricia L | $168,000 | -- | |
| Peter L Morris | $105,000 | -- | |
| -- | $89,900 | -- | |
| -- | $65,000 | -- |
Source: Public Records
Mortgage History
| Date | Status | Borrower | Loan Amount |
|---|---|---|---|
| Open | Moore Sally J | $170,000 | |
| Previous Owner | Peter L Morris | $99,750 |
Source: Public Records
Tax History Compared to Growth
Tax History
| Year | Tax Paid | Tax Assessment Tax Assessment Total Assessment is a certain percentage of the fair market value that is determined by local assessors to be the total taxable value of land and additions on the property. | Land | Improvement |
|---|---|---|---|---|
| 2024 | $5,583 | $124,390 | $49,350 | $75,040 |
| 2023 | $5,511 | $124,390 | $49,350 | $75,040 |
| 2022 | $6,149 | $118,550 | $36,020 | $82,530 |
| 2021 | $6,160 | $118,550 | $36,020 | $82,530 |
| 2020 | $6,148 | $118,170 | $36,020 | $82,150 |
| 2019 | $5,682 | $93,660 | $28,840 | $64,820 |
| 2018 | $4,887 | $93,660 | $28,840 | $64,820 |
| 2017 | $5,678 | $93,660 | $28,840 | $64,820 |
| 2016 | $4,521 | $68,250 | $24,850 | $43,400 |
| 2015 | $4,104 | $68,250 | $24,850 | $43,400 |
| 2014 | $4,114 | $68,250 | $24,850 | $43,400 |
| 2013 | $2,029 | $68,250 | $24,850 | $43,400 |
Source: Public Records
Map
Nearby Homes
- 197 E Cooke Rd
- 128 Blenheim Rd
- 340 Canyon Dr S
- 49 W Henderson Rd
- 111 W Henderson Rd
- 220 Ceramic Dr
- 221 Deland Ave
- 4464 Zeller Rd
- 4415 Aldrich Place
- 374 Acton Rd
- 4299 Colerain Ave
- 3726 N High St
- 238 W Henderson Rd
- 217 Arden Rd
- 4466 Olentangy Blvd
- 411 Garden Rd
- 125 Sheffield Rd
- 685 Yaronia Dr N
- 541 Northridge Rd
- 4193 Eastlea Dr
- 129 Indian Springs Dr
- 145 Indian Springs Dr
- 121 Indian Springs Dr
- 113 Indian Springs Dr
- 172 Overbrook Dr
- 120 Overbrook Dr
- 164 Overbrook Dr
- 105 Indian Springs Dr
- 140 Overbrook Dr
- 108 Overbrook Dr
- 100 Overbrook Dr
- 190 Overbrook Dr
- 99 Indian Springs Dr
- 92 Overbrook Dr
- 86 Overbrook Dr
- 91 Indian Springs Dr
- 4184 Foster St
- 78 Overbrook Dr
- 4190 Foster St
- 83 Indian Springs Dr