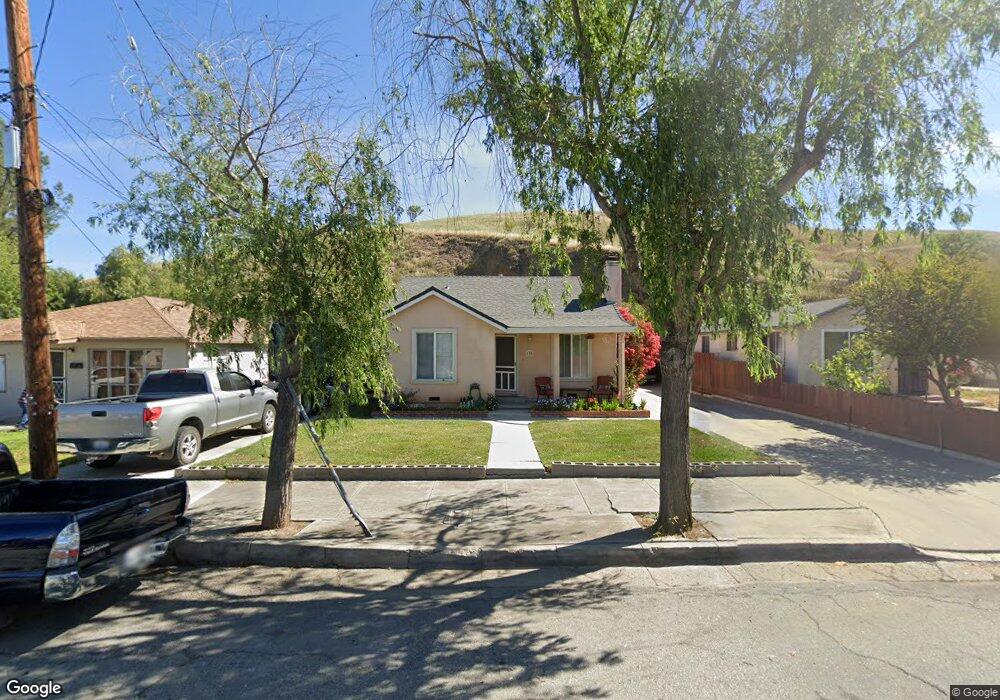
135 Locust Ave Hollister, CA 95023
Estimated Value: $564,000 - $687,000
3
Beds
1
Bath
1,066
Sq Ft
$572/Sq Ft
Est. Value
About This Home
This home is located at 135 Locust Ave, Hollister, CA 95023 and is currently estimated at $610,199, approximately $572 per square foot. 135 Locust Ave is a home located in San Benito County with nearby schools including Calaveras Elementary School, Maze Middle School, and San Benito High School.
Ownership History
Date
Name
Owned For
Owner Type
Purchase Details
Closed on
Mar 1, 2007
Sold by
Diaz Noemi Meza and Diaz Arturo
Bought by
Diaz Arturo and Diaz Noemi Meza
Current Estimated Value
Home Financials for this Owner
Home Financials are based on the most recent Mortgage that was taken out on this home.
Original Mortgage
$336,000
Outstanding Balance
$203,042
Interest Rate
6.23%
Mortgage Type
New Conventional
Estimated Equity
$407,157
Purchase Details
Closed on
Dec 6, 2004
Sold by
Diaz Noemi Meza and Robles Alejandro Diaz
Bought by
Diaz Arturo and Diaz Noemi Meza
Home Financials for this Owner
Home Financials are based on the most recent Mortgage that was taken out on this home.
Original Mortgage
$280,000
Interest Rate
4.89%
Mortgage Type
New Conventional
Purchase Details
Closed on
Sep 12, 2000
Sold by
Soares Vince J
Bought by
Meza Noemi and Robles Alejandro Diaz
Home Financials for this Owner
Home Financials are based on the most recent Mortgage that was taken out on this home.
Original Mortgage
$222,952
Interest Rate
9.38%
Create a Home Valuation Report for This Property
The Home Valuation Report is an in-depth analysis detailing your home's value as well as a comparison with similar homes in the area
Home Values in the Area
Average Home Value in this Area
Purchase History
| Date | Buyer | Sale Price | Title Company |
|---|---|---|---|
| Diaz Arturo | -- | Multiple | |
| Diaz Arturo | -- | Fidelity National Title Comp | |
| Meza Noemi | $248,000 | Chicago Title Co |
Source: Public Records
Mortgage History
| Date | Status | Borrower | Loan Amount |
|---|---|---|---|
| Open | Diaz Arturo | $336,000 | |
| Closed | Diaz Arturo | $280,000 | |
| Closed | Meza Noemi | $222,952 |
Source: Public Records
Tax History Compared to Growth
Tax History
| Year | Tax Paid | Tax Assessment Tax Assessment Total Assessment is a certain percentage of the fair market value that is determined by local assessors to be the total taxable value of land and additions on the property. | Land | Improvement |
|---|---|---|---|---|
| 2025 | $4,663 | $373,682 | $188,347 | $185,335 |
| 2023 | $4,663 | $359,173 | $181,034 | $178,139 |
| 2022 | $4,515 | $352,132 | $177,485 | $174,647 |
| 2021 | $4,453 | $345,228 | $174,005 | $171,223 |
| 2020 | $4,470 | $341,689 | $172,221 | $169,468 |
| 2019 | $4,343 | $334,991 | $168,845 | $166,146 |
| 2018 | $4,240 | $328,424 | $165,535 | $162,889 |
| 2017 | $4,183 | $321,986 | $162,290 | $159,696 |
| 2016 | $3,935 | $315,673 | $159,108 | $156,565 |
| 2015 | $3,682 | $292,350 | $153,650 | $138,700 |
| 2014 | $3,131 | $257,400 | $140,000 | $117,400 |
Source: Public Records
Map
Nearby Homes
- 190 San Benito St
- 101 Westside Blvd
- 0 Hwy 25 Unit 21712114
- 400 San Benito St Unit 309
- 400 San Benito St Unit 308
- 400 San Benito St Unit 202
- 400 San Benito St Unit 304
- 400 San Benito St Unit 212
- 400 San Benito St Unit 312
- 220 4th St
- 435 San Benito St
- 713 7th St
- 345 6th St
- 202 5th St
- 601 Chaparral Ct
- 500 Duran Dr
- 211 6th St
- 805 South St Unit 3
- 805 South St Unit 17
- 375 South St
- 141 Locust Ave
- 125 Locust Ave
- 153 Locust Ave
- 123 Locust Ave
- 126 Locust Ave
- 165 Locust Ave
- 140 Locust Ave
- 156 Locust Ave
- 122 Locust Ave
- 111 Locust Ave
- 162 Locust Ave
- 115 Locust Ave
- 116 Locust Ave
- 676 Canal Alley
- 107 Locust Ave
- 123 College St
- 110 Locust Ave
- 650 Central Ave
- 662 Central Ave
- 172 Locust Ave