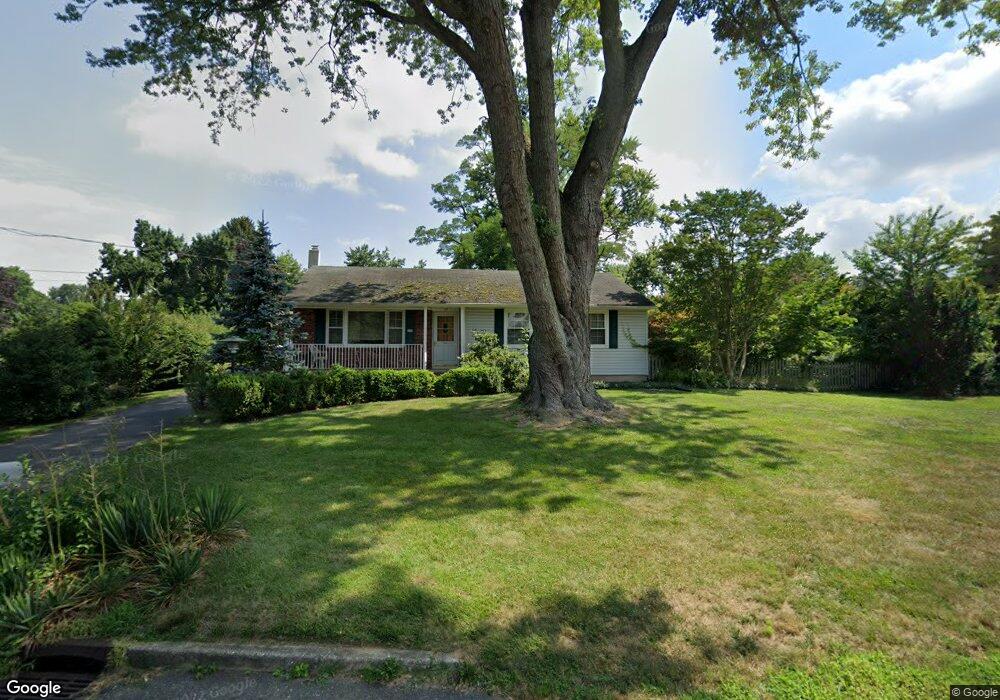
135 Manaqua Rd Freehold, NJ 07728
Adelphia NeighborhoodEstimated Value: $433,000 - $561,000
3
Beds
1
Bath
960
Sq Ft
$502/Sq Ft
Est. Value
About This Home
This home is located at 135 Manaqua Rd, Freehold, NJ 07728 and is currently estimated at $482,145, approximately $502 per square foot. 135 Manaqua Rd is a home located in Monmouth County with nearby schools including Adelphia Elementary School, Ardena School, and Howell Middle School North.
Ownership History
Date
Name
Owned For
Owner Type
Purchase Details
Closed on
Oct 5, 2023
Sold by
Beirne James S
Bought by
Kelley Zachary Paul
Current Estimated Value
Home Financials for this Owner
Home Financials are based on the most recent Mortgage that was taken out on this home.
Original Mortgage
$402,573
Outstanding Balance
$394,746
Interest Rate
7.18%
Mortgage Type
FHA
Estimated Equity
$87,399
Create a Home Valuation Report for This Property
The Home Valuation Report is an in-depth analysis detailing your home's value as well as a comparison with similar homes in the area
Home Values in the Area
Average Home Value in this Area
Purchase History
| Date | Buyer | Sale Price | Title Company |
|---|---|---|---|
| Kelley Zachary Paul | $410,000 | Acres Land Title | |
| Kelley Zachary Paul | $410,000 | Acres Land Title |
Source: Public Records
Mortgage History
| Date | Status | Borrower | Loan Amount |
|---|---|---|---|
| Open | Kelley Zachary Paul | $402,573 | |
| Closed | Kelley Zachary Paul | $402,573 |
Source: Public Records
Tax History Compared to Growth
Tax History
| Year | Tax Paid | Tax Assessment Tax Assessment Total Assessment is a certain percentage of the fair market value that is determined by local assessors to be the total taxable value of land and additions on the property. | Land | Improvement |
|---|---|---|---|---|
| 2025 | $6,980 | $416,300 | $299,100 | $117,200 |
| 2024 | $6,159 | $399,100 | $284,100 | $115,000 |
| 2023 | $6,159 | $336,400 | $224,100 | $112,300 |
| 2022 | $5,755 | $285,200 | $178,300 | $106,900 |
| 2021 | $5,755 | $266,200 | $171,100 | $95,100 |
| 2020 | $6,050 | $265,100 | $171,100 | $94,000 |
| 2019 | $5,790 | $248,500 | $156,100 | $92,400 |
| 2018 | $5,722 | $244,200 | $156,100 | $88,100 |
| 2017 | $5,918 | $249,900 | $156,100 | $93,800 |
| 2016 | $5,885 | $245,100 | $153,600 | $91,500 |
| 2015 | $5,410 | $233,200 | $144,100 | $89,100 |
| 2014 | $5,147 | $204,900 | $134,100 | $70,800 |
Source: Public Records
Map
Nearby Homes