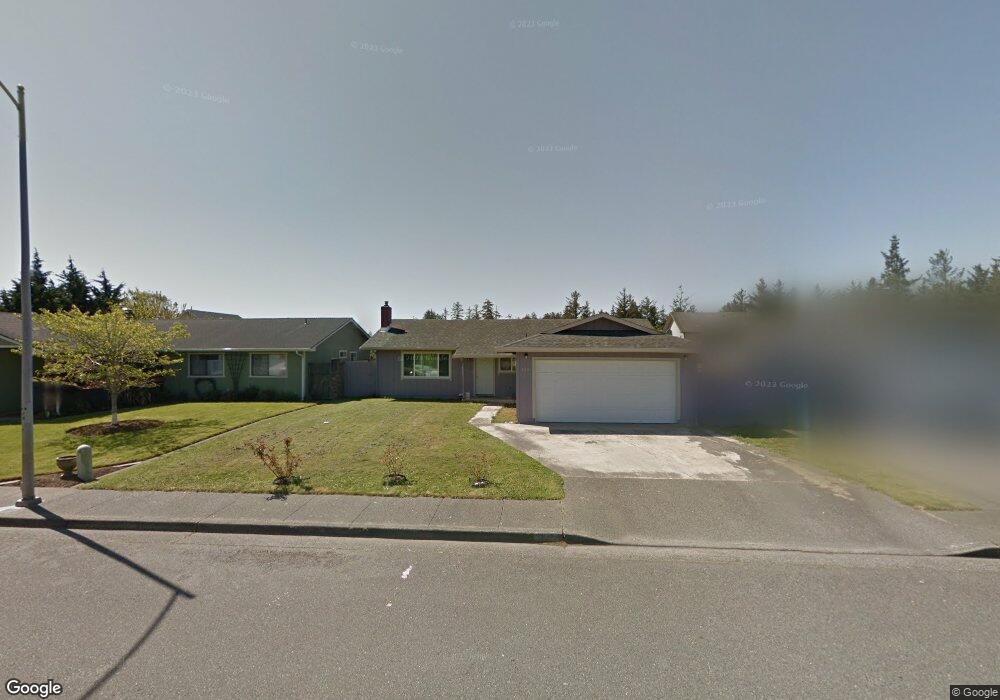
135 Mason Ct Crescent City, CA 95531
Estimated Value: $306,283 - $439,000
3
Beds
2
Baths
1,260
Sq Ft
$277/Sq Ft
Est. Value
About This Home
This home is located at 135 Mason Ct, Crescent City, CA 95531 and is currently estimated at $348,571, approximately $276 per square foot. 135 Mason Ct is a home located in Del Norte County with nearby schools including Bess Maxwell Elementary School, Crescent Elk Middle School, and Del Norte High School.
Ownership History
Date
Name
Owned For
Owner Type
Purchase Details
Closed on
Mar 20, 2009
Sold by
Mattz Elizabeth M and Kelley Elizabeth
Bought by
Mattz Emery W and Mattz Elizabeth M
Current Estimated Value
Home Financials for this Owner
Home Financials are based on the most recent Mortgage that was taken out on this home.
Original Mortgage
$148,265
Outstanding Balance
$93,621
Interest Rate
5.08%
Mortgage Type
FHA
Estimated Equity
$254,950
Purchase Details
Closed on
Feb 23, 2009
Sold by
Us Bank National Association
Bought by
Kelley Elizabeth
Home Financials for this Owner
Home Financials are based on the most recent Mortgage that was taken out on this home.
Original Mortgage
$148,265
Outstanding Balance
$93,621
Interest Rate
5.08%
Mortgage Type
FHA
Estimated Equity
$254,950
Purchase Details
Closed on
Nov 10, 2008
Sold by
Bocock Raymond C and Bocock Armeda G
Bought by
Us Bank National Association
Purchase Details
Closed on
Aug 6, 2003
Sold by
Ehorn William H and Ehorn Nancy F
Bought by
Bocock Raymond C and Bocock Armeida G
Home Financials for this Owner
Home Financials are based on the most recent Mortgage that was taken out on this home.
Original Mortgage
$105,000
Interest Rate
5.17%
Mortgage Type
USDA
Create a Home Valuation Report for This Property
The Home Valuation Report is an in-depth analysis detailing your home's value as well as a comparison with similar homes in the area
Home Values in the Area
Average Home Value in this Area
Purchase History
| Date | Buyer | Sale Price | Title Company |
|---|---|---|---|
| Mattz Emery W | -- | None Available | |
| Kelley Elizabeth | $151,000 | Accommodation | |
| Us Bank National Association | $162,070 | Accommodation | |
| Bocock Raymond C | $105,000 | First American Title Co |
Source: Public Records
Mortgage History
| Date | Status | Borrower | Loan Amount |
|---|---|---|---|
| Open | Kelley Elizabeth | $148,265 | |
| Previous Owner | Bocock Raymond C | $105,000 |
Source: Public Records
Tax History Compared to Growth
Tax History
| Year | Tax Paid | Tax Assessment Tax Assessment Total Assessment is a certain percentage of the fair market value that is determined by local assessors to be the total taxable value of land and additions on the property. | Land | Improvement |
|---|---|---|---|---|
| 2025 | $2,069 | $208,940 | $109,450 | $99,490 |
| 2024 | $2,069 | $204,910 | $107,304 | $97,606 |
| 2023 | $2,024 | $200,940 | $105,200 | $95,740 |
| 2022 | $1,980 | $197,010 | $103,138 | $93,872 |
| 2021 | $1,966 | $193,196 | $101,116 | $92,080 |
| 2020 | $1,951 | $191,121 | $100,080 | $91,041 |
| 2019 | $1,918 | $187,422 | $98,118 | $89,304 |
| 2018 | $1,876 | $183,687 | $96,195 | $87,492 |
| 2017 | $1,845 | $180,193 | $94,309 | $85,884 |
| 2016 | $1,808 | $176,354 | $92,460 | $83,894 |
| 2015 | $1,765 | $173,745 | $91,072 | $82,673 |
| 2014 | $1,745 | $170,174 | $89,289 | $80,885 |
Source: Public Records
Map
Nearby Homes
- 145 Mason Ct
- 120 W Coolidge Ave
- 373 Grant Ave
- 227 Ruchong Ln
- 125 W Washington Blvd
- 724 Butte St
- 545 Reddy Ave
- 1210 Douglas St
- 1102 Burtschell St
- 650 E Washington Blvd
- 650 E Washington Blvd Unit Crescent Senior Mobi
- 1329 Burtschell Place
- 0 E Adams Ave
- 941 Hamilton Ave
- 0000 E Washington Blvd
- 494 Cooper Ave
- 930 Mcnamara Ave
- 306 Butte St
- 00 Adams Ave
- 696 Cooper Ave