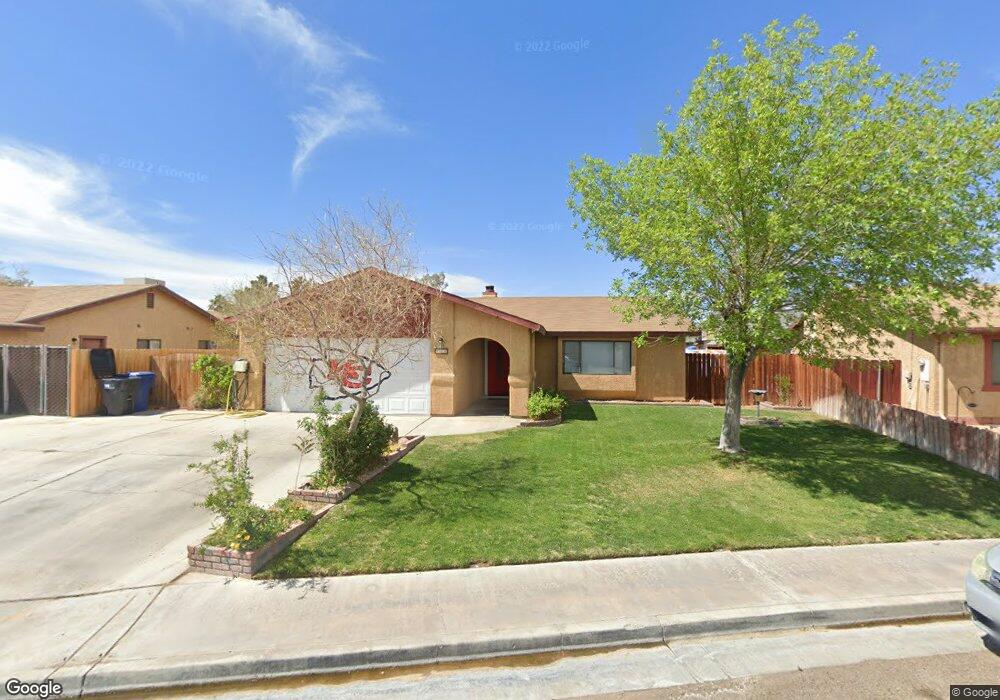
135 N Gwen Dr Unit C Ridgecrest, CA 93555
Estimated Value: $263,440 - $300,000
4
Beds
2
Baths
1,603
Sq Ft
$178/Sq Ft
Est. Value
About This Home
This home is located at 135 N Gwen Dr Unit C, Ridgecrest, CA 93555 and is currently estimated at $286,110, approximately $178 per square foot. 135 N Gwen Dr Unit C is a home located in Kern County with nearby schools including Pierce Elementary School, Murray Middle School, and Burroughs High School.
Ownership History
Date
Name
Owned For
Owner Type
Purchase Details
Closed on
Jun 6, 2003
Sold by
Short James C
Bought by
Galyon David R and Galyon Selina C
Current Estimated Value
Home Financials for this Owner
Home Financials are based on the most recent Mortgage that was taken out on this home.
Original Mortgage
$132,090
Outstanding Balance
$55,674
Interest Rate
5.26%
Mortgage Type
VA
Estimated Equity
$230,436
Purchase Details
Closed on
Nov 20, 2001
Sold by
Short Helen M
Bought by
Short James C
Home Financials for this Owner
Home Financials are based on the most recent Mortgage that was taken out on this home.
Original Mortgage
$93,532
Interest Rate
6.63%
Mortgage Type
FHA
Purchase Details
Closed on
Nov 12, 2001
Sold by
Gilmore James Tod and Gilmore Sandra K
Bought by
Short James C
Home Financials for this Owner
Home Financials are based on the most recent Mortgage that was taken out on this home.
Original Mortgage
$93,532
Interest Rate
6.63%
Mortgage Type
FHA
Create a Home Valuation Report for This Property
The Home Valuation Report is an in-depth analysis detailing your home's value as well as a comparison with similar homes in the area
Home Values in the Area
Average Home Value in this Area
Purchase History
| Date | Buyer | Sale Price | Title Company |
|---|---|---|---|
| Galyon David R | $129,500 | First American Title | |
| Short James C | -- | First American Title Co | |
| Short James C | $95,000 | First American Title Co |
Source: Public Records
Mortgage History
| Date | Status | Borrower | Loan Amount |
|---|---|---|---|
| Open | Galyon David R | $132,090 | |
| Previous Owner | Short James C | $93,532 |
Source: Public Records
Tax History Compared to Growth
Tax History
| Year | Tax Paid | Tax Assessment Tax Assessment Total Assessment is a certain percentage of the fair market value that is determined by local assessors to be the total taxable value of land and additions on the property. | Land | Improvement |
|---|---|---|---|---|
| 2025 | $2,536 | $183,245 | $28,423 | $154,822 |
| 2024 | $2,463 | $179,653 | $27,866 | $151,787 |
| 2023 | $2,463 | $176,131 | $27,320 | $148,811 |
| 2022 | $2,413 | $172,679 | $26,785 | $145,894 |
| 2021 | $2,340 | $169,294 | $26,260 | $143,034 |
| 2020 | $2,285 | $167,559 | $25,991 | $141,568 |
| 2019 | $2,249 | $167,559 | $25,991 | $141,568 |
| 2018 | $2,209 | $161,055 | $24,983 | $136,072 |
| 2017 | $2,203 | $157,898 | $24,494 | $133,404 |
| 2016 | $2,066 | $150,000 | $38,000 | $112,000 |
| 2015 | $1,682 | $115,000 | $29,000 | $86,000 |
| 2014 | $1,742 | $131,000 | $33,000 | $98,000 |
Source: Public Records
Map
Nearby Homes
- 124 Jacquelyn Ct
- 142 Chambers St Unit K
- 134 N American St
- 625 Cottonwood Dr
- 632-A Commercial
- 1 E Ridgecrest Blvd
- 729 N Sunland Dr Unit H
- 0 S Gateway Blvd
- 2005 S American St
- 525 E Ridgecrest Blvd Unit 11
- 217 S American St
- 504 Commercial Ave Unit A
- 228 S Greenlawn St
- 205 Rancho St
- 645 E Church Ave
- 112 Valley St
- 218 S Sunland St
- 229 Rancho St
- 132 S Holly Canyon Dr
- 601 E Church Ave
- 131 N Gwen Dr Unit C
- 139 N Gwen Dr
- 148 Jacquelyn Ct
- 205 N Broadway St
- 144 Jacquelyn Ct
- 127 N Gwen Dr
- 209 N Broadway St
- 136 N Gwen Dr Unit C
- 155 Jacquelyn Ct Unit B
- 140 N Gwen Dr
- 130 N Gwen Dr Unit C
- 138 Jacquelyn Ct Unit B
- 124 N Gwen Dr
- 123 N Gwen Dr Unit C
- 200 N Broadway St
- 134 Jacquelyn Ct
- 204 N Broadway St
- 151 Jacquelyn Ct
- 123 N Broadway St Unit D
- 208 N Broadway St