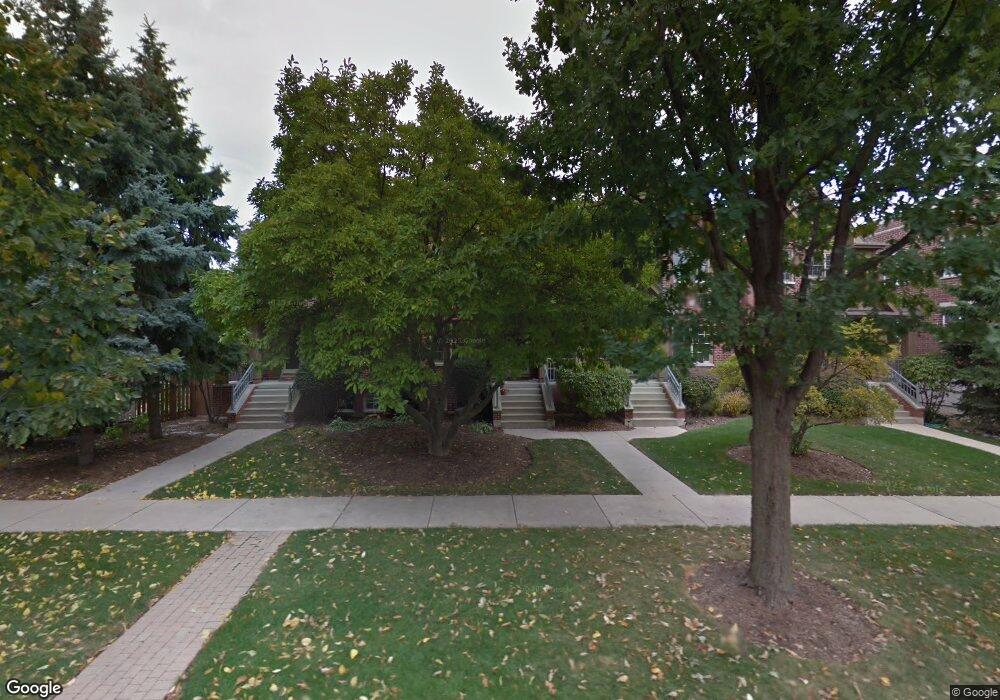
135 N Larch Ave Elmhurst, IL 60126
Estimated Value: $876,959 - $905,000
Studio
--
Bath
2,192
Sq Ft
$408/Sq Ft
Est. Value
About This Home
This home is located at 135 N Larch Ave, Elmhurst, IL 60126 and is currently estimated at $893,740, approximately $407 per square foot. 135 N Larch Ave is a home located in DuPage County with nearby schools including Hawthorne Elementary School, Sandburg Middle School, and York Community High School.
Ownership History
Date
Name
Owned For
Owner Type
Purchase Details
Closed on
Sep 24, 2025
Sold by
Freislinger John and Freislinger Charlene
Bought by
Elliott Family Revocable Trust and Elliott
Current Estimated Value
Purchase Details
Closed on
Apr 30, 1998
Sold by
Amerimark Bank
Bought by
Freislinger John and Freislinger Charlene
Home Financials for this Owner
Home Financials are based on the most recent Mortgage that was taken out on this home.
Original Mortgage
$250,000
Interest Rate
7.2%
Mortgage Type
Purchase Money Mortgage
Purchase Details
Closed on
Jun 5, 1997
Sold by
Wolf Susan Jean
Bought by
Bank Of Illinois In Dupage and Trust #93-312
Home Financials for this Owner
Home Financials are based on the most recent Mortgage that was taken out on this home.
Original Mortgage
$900,000
Interest Rate
8.5%
Mortgage Type
Construction
Create a Home Valuation Report for This Property
The Home Valuation Report is an in-depth analysis detailing your home's value as well as a comparison with similar homes in the area
Home Values in the Area
Average Home Value in this Area
Purchase History
| Date | Buyer | Sale Price | Title Company |
|---|---|---|---|
| Elliott Family Revocable Trust | $899,000 | Chicago Title | |
| Freislinger John | $356,000 | Chicago Title Insurance Co | |
| Bank Of Illinois In Dupage | $340,000 | -- |
Source: Public Records
Mortgage History
| Date | Status | Borrower | Loan Amount |
|---|---|---|---|
| Previous Owner | Freislinger John | $250,000 | |
| Previous Owner | Bank Of Illinois In Dupage | $900,000 |
Source: Public Records
Tax History
| Year | Tax Paid | Tax Assessment Tax Assessment Total Assessment is a certain percentage of the fair market value that is determined by local assessors to be the total taxable value of land and additions on the property. | Land | Improvement |
|---|---|---|---|---|
| 2024 | $12,074 | $221,352 | $22,136 | $199,216 |
| 2023 | -- | $204,690 | $20,470 | $184,220 |
| 2022 | $0 | $201,260 | $20,130 | $181,130 |
| 2021 | $11,124 | $196,260 | $19,630 | $176,630 |
| 2020 | $10,686 | $191,960 | $19,200 | $172,760 |
| 2019 | $10,441 | $182,500 | $18,250 | $164,250 |
| 2018 | $9,749 | $170,360 | $17,040 | $153,320 |
| 2017 | $10,117 | $171,790 | $17,190 | $154,600 |
| 2016 | $9,880 | $161,830 | $16,190 | $145,640 |
| 2015 | $9,750 | $150,760 | $15,080 | $135,680 |
| 2014 | $9,140 | $129,610 | $12,970 | $116,640 |
| 2013 | $9,046 | $131,430 | $13,150 | $118,280 |
Source: Public Records
Map
Nearby Homes
- 105 S Cottage Hill Ave Unit 304
- 105 S Cottage Hill Ave Unit 206
- 210 N Addison Ave Unit 301N
- 195 N Addison Ave Unit PH03
- 142 W 3rd St
- 135 S York St Unit 314
- 145 S York St Unit 404
- 108 Evergreen Ave
- 104 Evergreen Ave
- 147 N Myrtle Ave
- 254 N Addison Ave
- 256 N Addison Ave
- 258 N Addison Ave
- 260 N Addison Ave
- 146 N Walnut St
- 176 S Arlington Ave
- 196 N Walnut St
- 110 N Willow Rd
- 275 W North Ave
- 293 N Illinois St
- 133 N Larch Ave
- 137 N Larch Ave
- 137 N Larch Ave Unit 1A
- 131 N Larch Ave Unit 2B
- 139 N Larch Ave
- 111 N Larch Ave Unit 203
- 111 N Larch Ave Unit 302
- 111 N Larch Ave Unit 309
- 111 N Larch Ave Unit 303
- 111 N Larch Ave Unit 301
- 111 N Larch Ave Unit 209
- 111 N Larch Ave Unit 202
- 111 N Larch Ave Unit 210
- 111 N Larch Ave Unit 304
- 111 N Larch Ave Unit 308
- 111 N Larch Ave Unit 207
- 111 N Larch Ave Unit 310
- 111 N Larch Ave Unit 201
- 111 N Larch Ave Unit 205
- 111 N Larch Ave Unit 402
Your Personal Tour Guide
Ask me questions while you tour the home.