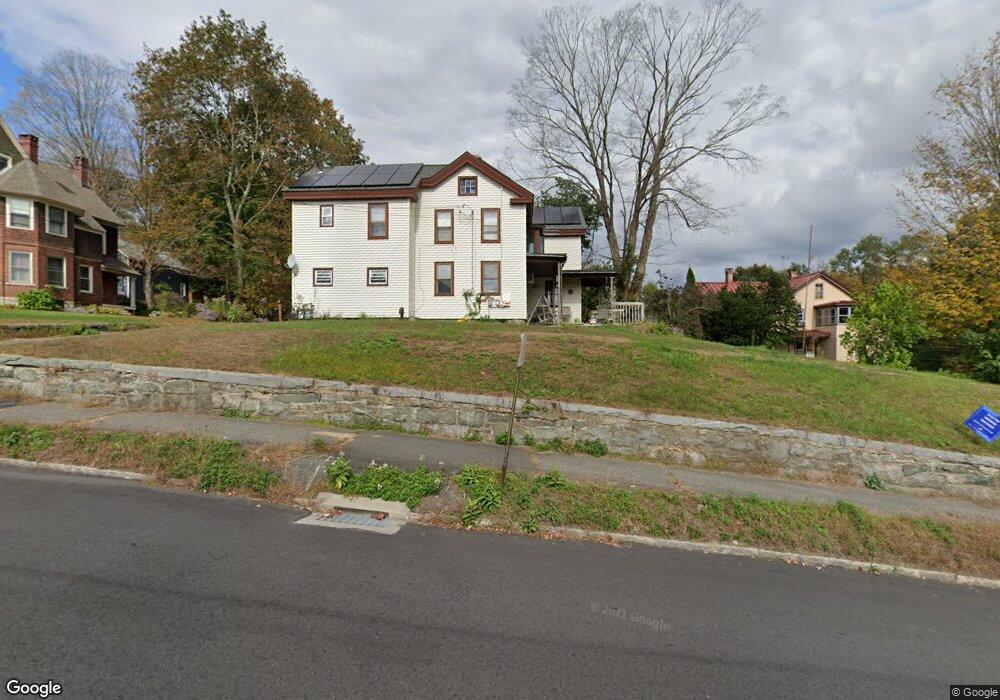
135 N Main St Winsted, CT 06098
Estimated Value: $252,892 - $322,000
6
Beds
2
Baths
2,548
Sq Ft
$113/Sq Ft
Est. Value
About This Home
This home is located at 135 N Main St, Winsted, CT 06098 and is currently estimated at $288,723, approximately $113 per square foot. 135 N Main St is a home located in Litchfield County with nearby schools including Explorations Charter School, St Anthony School, and The Gilbert School.
Ownership History
Date
Name
Owned For
Owner Type
Purchase Details
Closed on
Jan 28, 2019
Sold by
Lemelin John A and Lemelin Teri J
Bought by
Lemelin John A
Current Estimated Value
Home Financials for this Owner
Home Financials are based on the most recent Mortgage that was taken out on this home.
Original Mortgage
$113,298
Outstanding Balance
$100,635
Interest Rate
5.12%
Mortgage Type
FHA
Estimated Equity
$188,088
Purchase Details
Closed on
Dec 5, 2017
Sold by
Lemelin Teri J
Bought by
Lemelin John A
Purchase Details
Closed on
May 13, 2002
Sold by
Spring Loretta and Arthur Lemelin J
Bought by
Kolasky Peter and Kolasky Laurie L
Purchase Details
Closed on
Jul 14, 1989
Sold by
Lemelin Joseph
Bought by
Lemelin John A
Create a Home Valuation Report for This Property
The Home Valuation Report is an in-depth analysis detailing your home's value as well as a comparison with similar homes in the area
Home Values in the Area
Average Home Value in this Area
Purchase History
| Date | Buyer | Sale Price | Title Company |
|---|---|---|---|
| Lemelin John A | -- | -- | |
| Lemelin John A | -- | -- | |
| Lemelin John A | -- | -- | |
| Lemelin John A | -- | -- | |
| Kolasky Peter | $5,000 | -- | |
| Kolasky Peter | $5,000 | -- | |
| Lemelin John A | $45,767 | -- |
Source: Public Records
Mortgage History
| Date | Status | Borrower | Loan Amount |
|---|---|---|---|
| Open | Lemelin John A | $113,298 | |
| Closed | Lemelin John A | $113,298 | |
| Previous Owner | Lemelin John A | $120,000 | |
| Previous Owner | Lemelin John A | $80,000 |
Source: Public Records
Tax History Compared to Growth
Tax History
| Year | Tax Paid | Tax Assessment Tax Assessment Total Assessment is a certain percentage of the fair market value that is determined by local assessors to be the total taxable value of land and additions on the property. | Land | Improvement |
|---|---|---|---|---|
| 2025 | $3,682 | $126,210 | $26,950 | $99,260 |
| 2024 | $3,438 | $126,210 | $26,950 | $99,260 |
| 2023 | $3,331 | $126,210 | $26,950 | $99,260 |
| 2022 | $3,038 | $90,580 | $19,670 | $70,910 |
| 2021 | $3,038 | $90,580 | $19,670 | $70,910 |
| 2020 | $3,038 | $90,580 | $19,670 | $70,910 |
| 2019 | $3,038 | $90,580 | $19,670 | $70,910 |
| 2018 | $3,038 | $90,580 | $19,670 | $70,910 |
| 2017 | $3,078 | $91,770 | $19,670 | $72,100 |
| 2016 | $3,078 | $91,770 | $19,670 | $72,100 |
| 2015 | $3,001 | $91,770 | $19,670 | $72,100 |
| 2014 | $2,928 | $91,770 | $19,670 | $72,100 |
Source: Public Records
Map
Nearby Homes
- 143 N Main St
- 139 N Main St
- 139 N Main St Unit 2
- 139 N Main St Unit LL
- 139 N Main St Unit 3
- 143 Wetmore Ave
- 116 N Main St
- 110 N Main St
- 153 Wetmore Ave
- 147 Wetmore Ave
- 140 Wetmore Ave
- 144 Wetmore Ave
- 144 Wetmore Ave Unit 2
- 144 Wetmore Ave Unit 3
- 144 Wetmore Ave Unit 1
- 157 N Main St
- 149 Wetmore Ave
- 163 N Main St
- 133 Wetmore Ave
- 163 Holabird Ave