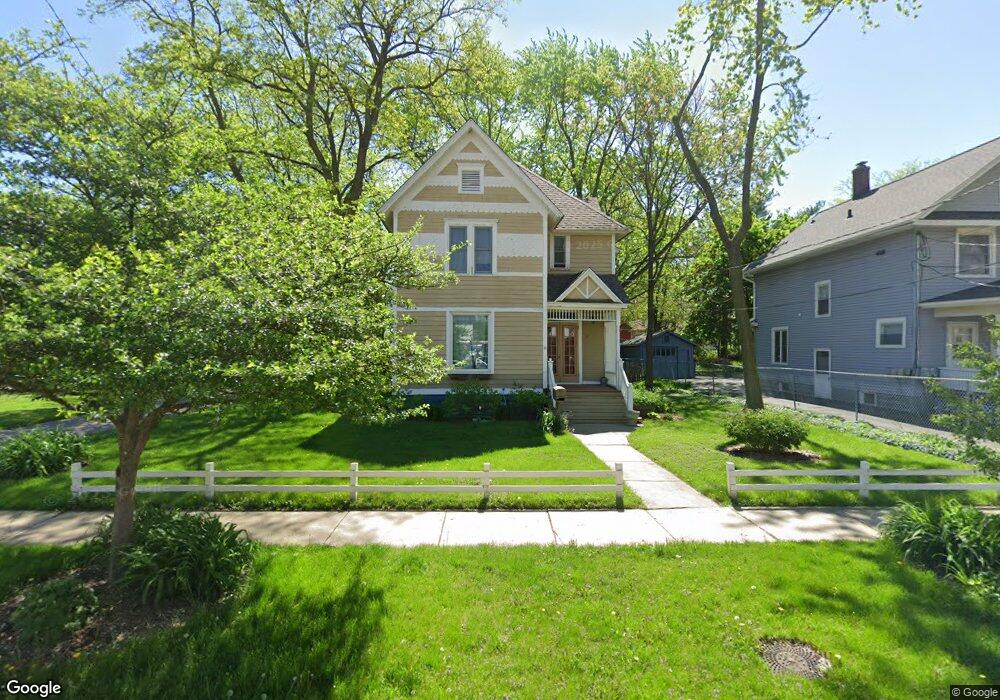
135 N Root St Aurora, IL 60505
McCarty Burlington NeighborhoodEstimated Value: $264,000 - $377,000
4
Beds
--
Bath
2,798
Sq Ft
$110/Sq Ft
Est. Value
About This Home
This home is located at 135 N Root St, Aurora, IL 60505 and is currently estimated at $307,146, approximately $109 per square foot. 135 N Root St is a home located in Kane County with nearby schools including Brady Elementary School, Simmons Middle School, and East Aurora High School.
Ownership History
Date
Name
Owned For
Owner Type
Purchase Details
Closed on
Jun 1, 1998
Sold by
Pederson Peder and Pederson Virginia
Bought by
Hook Matthew and Hook Heather
Current Estimated Value
Home Financials for this Owner
Home Financials are based on the most recent Mortgage that was taken out on this home.
Original Mortgage
$116,500
Outstanding Balance
$23,855
Interest Rate
7.32%
Estimated Equity
$283,291
Purchase Details
Closed on
Jul 16, 1996
Sold by
Smith Lois
Bought by
Pedersen Peder
Create a Home Valuation Report for This Property
The Home Valuation Report is an in-depth analysis detailing your home's value as well as a comparison with similar homes in the area
Home Values in the Area
Average Home Value in this Area
Purchase History
| Date | Buyer | Sale Price | Title Company |
|---|---|---|---|
| Hook Matthew | $129,500 | First American Title Ins Co | |
| Pedersen Peder | $3,000 | -- |
Source: Public Records
Mortgage History
| Date | Status | Borrower | Loan Amount |
|---|---|---|---|
| Open | Hook Matthew | $116,500 |
Source: Public Records
Tax History
| Year | Tax Paid | Tax Assessment Tax Assessment Total Assessment is a certain percentage of the fair market value that is determined by local assessors to be the total taxable value of land and additions on the property. | Land | Improvement |
|---|---|---|---|---|
| 2024 | $4,823 | $78,352 | $5,315 | $73,037 |
| 2023 | $4,634 | $70,007 | $4,749 | $65,258 |
| 2022 | $4,397 | $63,875 | $4,333 | $59,542 |
| 2021 | $4,316 | $59,468 | $4,034 | $55,434 |
| 2020 | $4,095 | $55,237 | $3,747 | $51,490 |
| 2019 | $3,981 | $51,179 | $3,472 | $47,707 |
| 2018 | $3,578 | $45,299 | $3,212 | $42,087 |
| 2017 | $3,526 | $41,959 | $2,960 | $38,999 |
| 2016 | $3,236 | $36,747 | $2,537 | $34,210 |
| 2015 | -- | $32,737 | $2,182 | $30,555 |
| 2014 | -- | $31,041 | $2,005 | $29,036 |
| 2013 | -- | $33,777 | $1,916 | $31,861 |
Source: Public Records
Map
Nearby Homes
Your Personal Tour Guide
Ask me questions while you tour the home.