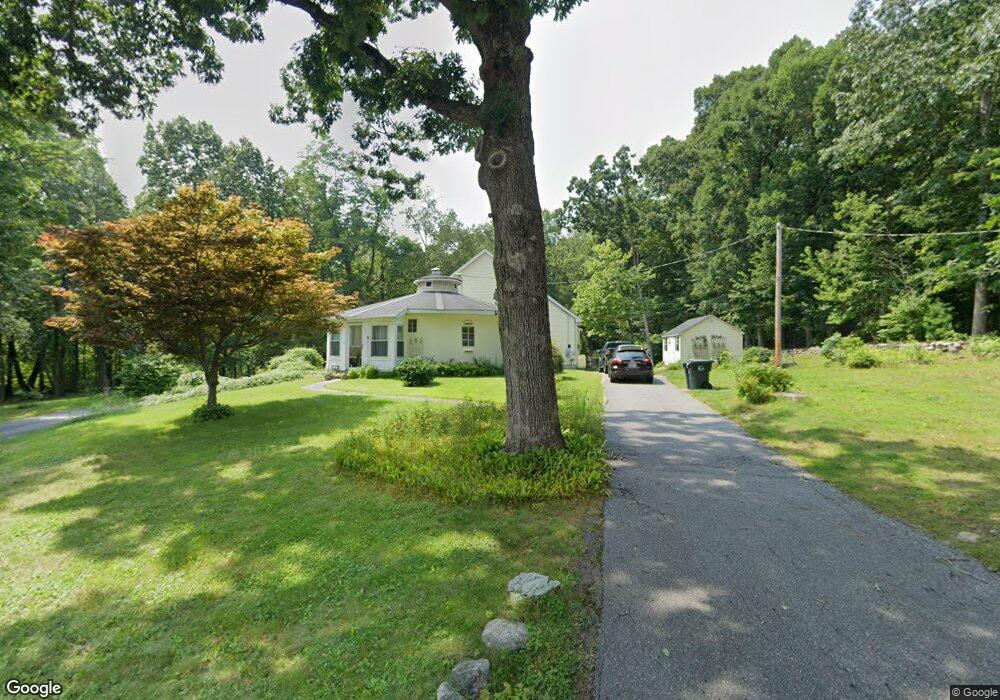
135 Nelson St Holden, MA 01520
Estimated Value: $444,000 - $575,000
3
Beds
2
Baths
2,571
Sq Ft
$193/Sq Ft
Est. Value
About This Home
This home is located at 135 Nelson St, Holden, MA 01520 and is currently estimated at $497,298, approximately $193 per square foot. 135 Nelson St is a home with nearby schools including Wachusett Regional High School.
Ownership History
Date
Name
Owned For
Owner Type
Purchase Details
Closed on
Oct 6, 2022
Sold by
Peters Jonathan E and Peters Catherine M
Bought by
Peters Jonathan and Peters Tiffany R
Current Estimated Value
Home Financials for this Owner
Home Financials are based on the most recent Mortgage that was taken out on this home.
Original Mortgage
$320,000
Outstanding Balance
$306,033
Interest Rate
5.55%
Mortgage Type
Purchase Money Mortgage
Estimated Equity
$191,265
Purchase Details
Closed on
Dec 21, 2004
Sold by
Handley Catherine M and Handley Robert E
Bought by
Peters Catherine M and Peters Jonathan E
Purchase Details
Closed on
Nov 8, 1984
Bought by
Peters Jonathan E
Create a Home Valuation Report for This Property
The Home Valuation Report is an in-depth analysis detailing your home's value as well as a comparison with similar homes in the area
Home Values in the Area
Average Home Value in this Area
Purchase History
| Date | Buyer | Sale Price | Title Company |
|---|---|---|---|
| Peters Jonathan | $320,000 | None Available | |
| Peters Catherine M | -- | -- | |
| Peters Catherine M | -- | -- | |
| Peters Jonathan E | $43,000 | -- |
Source: Public Records
Mortgage History
| Date | Status | Borrower | Loan Amount |
|---|---|---|---|
| Open | Peters Jonathan | $320,000 |
Source: Public Records
Tax History Compared to Growth
Tax History
| Year | Tax Paid | Tax Assessment Tax Assessment Total Assessment is a certain percentage of the fair market value that is determined by local assessors to be the total taxable value of land and additions on the property. | Land | Improvement |
|---|---|---|---|---|
| 2025 | $6,940 | $500,700 | $172,100 | $328,600 |
| 2024 | $6,935 | $490,100 | $167,300 | $322,800 |
| 2023 | $6,740 | $449,600 | $145,300 | $304,300 |
| 2022 | $6,627 | $400,200 | $114,500 | $285,700 |
| 2021 | $3,481 | $369,000 | $109,300 | $259,700 |
| 2020 | $5,938 | $349,300 | $104,500 | $244,800 |
| 2019 | $5,837 | $334,500 | $104,500 | $230,000 |
| 2018 | $2,918 | $314,900 | $99,700 | $215,200 |
| 2017 | $5,405 | $307,300 | $99,700 | $207,600 |
| 2016 | $5,096 | $295,400 | $95,300 | $200,100 |
| 2015 | $5,077 | $280,200 | $95,300 | $184,900 |
| 2014 | $4,974 | $280,200 | $95,300 | $184,900 |
Source: Public Records
Map
Nearby Homes