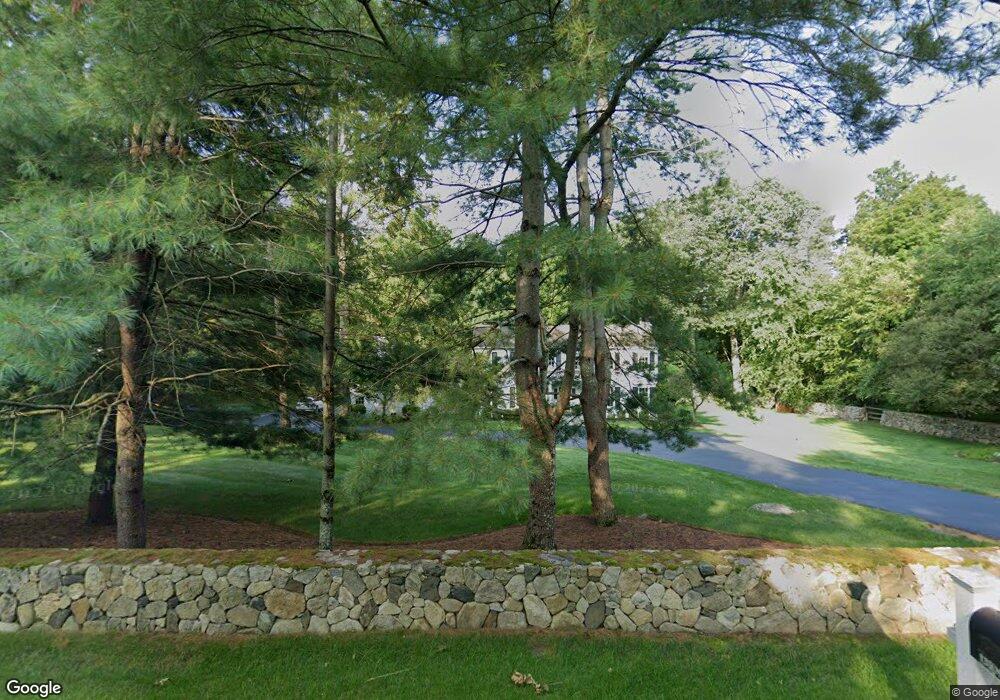
135 Nod Rd Ridgefield, CT 06877
Estimated Value: $1,811,950 - $2,012,000
4
Beds
5
Baths
3,994
Sq Ft
$476/Sq Ft
Est. Value
About This Home
This home is located at 135 Nod Rd, Ridgefield, CT 06877 and is currently estimated at $1,901,238, approximately $476 per square foot. 135 Nod Rd is a home located in Fairfield County with nearby schools including Branchville Elementary School, Ridgefield High School, and St. Mary School.
Ownership History
Date
Name
Owned For
Owner Type
Purchase Details
Closed on
Apr 22, 2005
Sold by
Gray James E and Gray Sheila
Bought by
Martinez Walfrido J and Currier-Martinez Lisette
Current Estimated Value
Purchase Details
Closed on
Mar 12, 2004
Sold by
Hanson Lisa and Hanson Gregory F
Bought by
Gray James E and Gray Sheila
Purchase Details
Closed on
Dec 30, 1996
Sold by
Brennan Kathleen E
Bought by
Hanson Gregoryh F and Hanson Lisa
Create a Home Valuation Report for This Property
The Home Valuation Report is an in-depth analysis detailing your home's value as well as a comparison with similar homes in the area
Home Values in the Area
Average Home Value in this Area
Purchase History
| Date | Buyer | Sale Price | Title Company |
|---|---|---|---|
| Martinez Walfrido J | $1,400,000 | -- | |
| Gray James E | $1,100,000 | -- | |
| Hanson Gregoryh F | $620,000 | -- |
Source: Public Records
Mortgage History
| Date | Status | Borrower | Loan Amount |
|---|---|---|---|
| Open | Hanson Gregoryh F | $560,650 | |
| Closed | Hanson Gregoryh F | $672,000 |
Source: Public Records
Tax History
| Year | Tax Paid | Tax Assessment Tax Assessment Total Assessment is a certain percentage of the fair market value that is determined by local assessors to be the total taxable value of land and additions on the property. | Land | Improvement |
|---|---|---|---|---|
| 2025 | $25,375 | $926,450 | $350,000 | $576,450 |
| 2024 | $24,412 | $926,450 | $350,000 | $576,450 |
| 2023 | $23,912 | $926,450 | $350,000 | $576,450 |
| 2022 | $22,798 | $801,900 | $238,000 | $563,900 |
| 2021 | $22,622 | $801,900 | $238,000 | $563,900 |
| 2020 | $22,549 | $801,900 | $238,000 | $563,900 |
| 2019 | $22,549 | $801,900 | $238,000 | $563,900 |
| 2018 | $22,277 | $801,900 | $238,000 | $563,900 |
| 2017 | $25,213 | $926,620 | $344,960 | $581,660 |
| 2016 | $24,731 | $926,620 | $344,960 | $581,660 |
| 2015 | $24,101 | $926,620 | $344,960 | $581,660 |
| 2014 | $24,101 | $926,620 | $344,960 | $581,660 |
Source: Public Records
Map
Nearby Homes
- 134 Nod Rd
- Lot 6 Cattle Pen Ln
- 30 Rising Ridge Rd
- 274 Nod Rd
- 25 Eustis Ln
- 87 Silver Hill Rd
- 160 Wilton Rd W
- 6 Morganti Ct
- 164 Wilton Rd W
- 94 Soundview Rd
- 174 Branchville Rd
- 23 Olmstead Ln
- 84 Olmstead Ln
- 131 Indian Hill Rd
- 913 Ridgefield Rd
- 0 Salem Rd S
- 26 Wilridge Rd
- 78 Pin Oak Ln
- 14 Tanners Dr
- 27 Country Club Rd
Your Personal Tour Guide
Ask me questions while you tour the home.