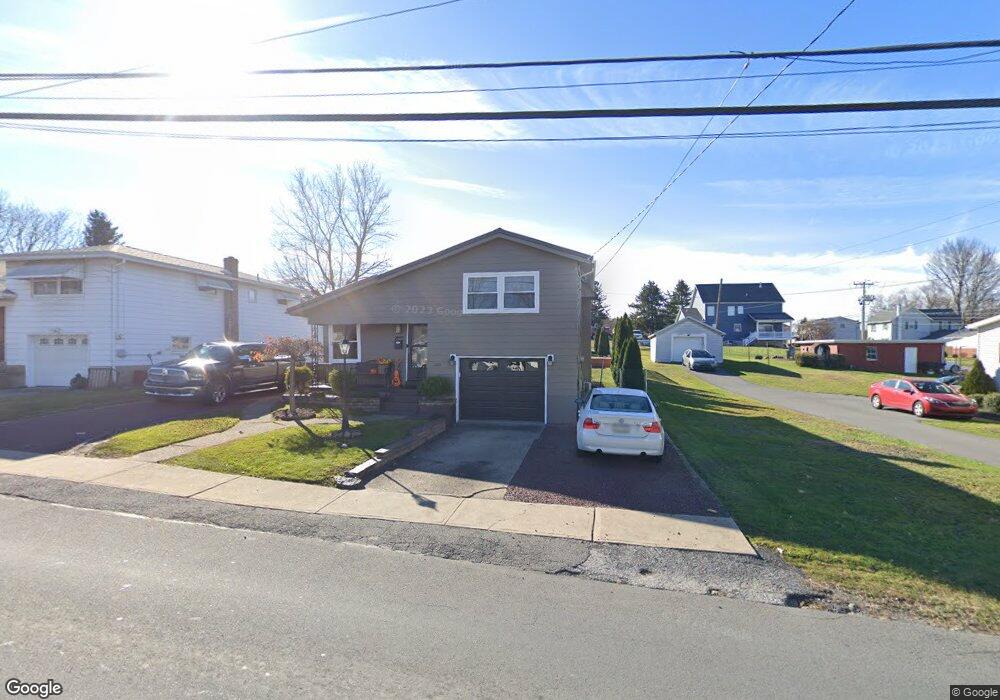
135 Oak St Pittston, PA 18640
Estimated Value: $179,000 - $216,000
3
Beds
2
Baths
1,200
Sq Ft
$165/Sq Ft
Est. Value
About This Home
This home is located at 135 Oak St, Pittston, PA 18640 and is currently estimated at $198,125, approximately $165 per square foot. 135 Oak St is a home located in Luzerne County with nearby schools including Pittston City Intermediate Center, Pittston Area Middle School, and Pittston Area Senior High School.
Ownership History
Date
Name
Owned For
Owner Type
Purchase Details
Closed on
Feb 3, 2023
Sold by
Argo Andria M
Bought by
Argo Andria M
Current Estimated Value
Purchase Details
Closed on
Jan 28, 2014
Sold by
Best Caitlin A
Bought by
Argo Adria M and Argo Samuel D
Home Financials for this Owner
Home Financials are based on the most recent Mortgage that was taken out on this home.
Original Mortgage
$90,862
Interest Rate
4.5%
Mortgage Type
FHA
Purchase Details
Closed on
Jul 1, 2011
Sold by
Buckley Robert T and Buckley Joseph W
Bought by
Best Caitlin A
Create a Home Valuation Report for This Property
The Home Valuation Report is an in-depth analysis detailing your home's value as well as a comparison with similar homes in the area
Home Values in the Area
Average Home Value in this Area
Purchase History
| Date | Buyer | Sale Price | Title Company |
|---|---|---|---|
| Argo Andria M | -- | -- | |
| Argo Andria M | -- | None Listed On Document | |
| Argo Adria M | $92,550 | None Available | |
| Best Caitlin A | $85,000 | None Available |
Source: Public Records
Mortgage History
| Date | Status | Borrower | Loan Amount |
|---|---|---|---|
| Previous Owner | Argo Adria M | $90,862 |
Source: Public Records
Tax History Compared to Growth
Tax History
| Year | Tax Paid | Tax Assessment Tax Assessment Total Assessment is a certain percentage of the fair market value that is determined by local assessors to be the total taxable value of land and additions on the property. | Land | Improvement |
|---|---|---|---|---|
| 2025 | $2,152 | $86,800 | $30,500 | $56,300 |
| 2024 | $2,118 | $86,800 | $30,500 | $56,300 |
| 2023 | $2,118 | $86,800 | $30,500 | $56,300 |
| 2022 | $2,058 | $86,800 | $30,500 | $56,300 |
| 2021 | $2,036 | $86,800 | $30,500 | $56,300 |
| 2020 | $1,988 | $86,800 | $30,500 | $56,300 |
| 2019 | $1,971 | $86,800 | $30,500 | $56,300 |
| 2018 | $1,906 | $86,800 | $30,500 | $56,300 |
| 2017 | $1,862 | $86,800 | $30,500 | $56,300 |
| 2016 | -- | $86,800 | $30,500 | $56,300 |
| 2015 | $1,456 | $86,800 | $30,500 | $56,300 |
| 2014 | $1,456 | $86,800 | $30,500 | $56,300 |
Source: Public Records
Map
Nearby Homes