Estimated Value: $785,118 - $1,122,000
Studio
--
Bath
1,243
Sq Ft
$783/Sq Ft
Est. Value
About This Home
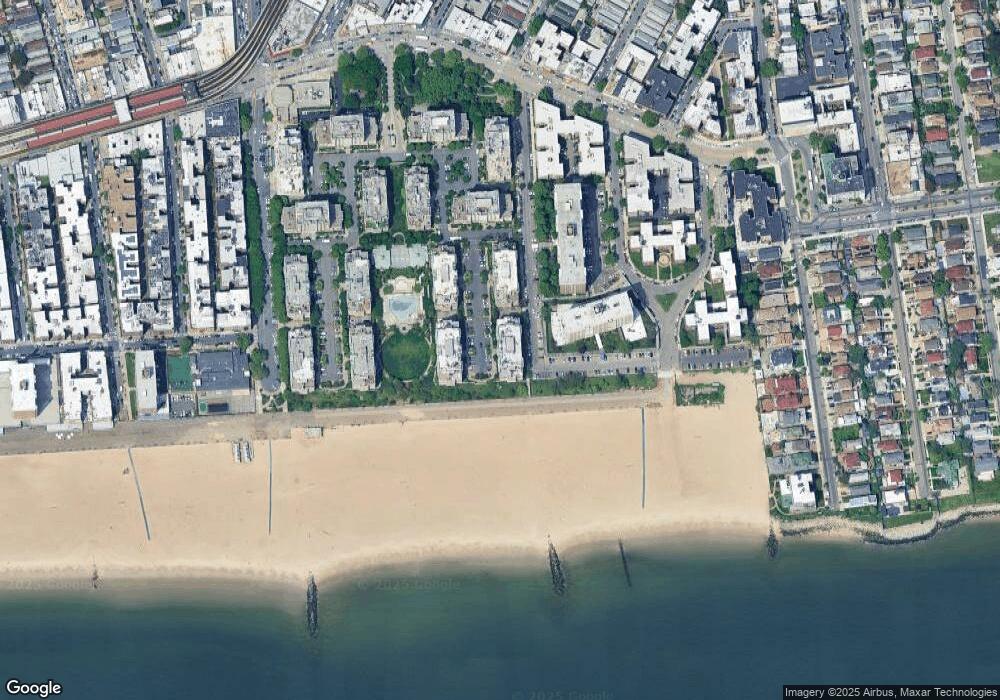
This home is located at 135 Oceana Dr E Unit 6A, Brooklyn, NY 11235 and is currently estimated at $973,280, approximately $783 per square foot. 135 Oceana Dr E Unit 6A is a home located in Kings County with nearby schools including P.S. K225 - The Eileen E. Zaglin School, Abraham Lincoln High School, and Mazel Day School.
Ownership History
Date
Name
Owned For
Owner Type
Purchase Details
Closed on
Aug 2, 2021
Sold by
Grinberg Laura and Grinberg Leonid
Bought by
Grinberg Laura and Grinberg Leonid
Current Estimated Value
Purchase Details
Closed on
Dec 21, 2019
Sold by
Grinberg Laura and Grinberg Leonid
Bought by
Grinberg Laura and Grinberg Leonid
Purchase Details
Closed on
Sep 28, 2016
Sold by
Estate Of Marina Sirota and Laura Grinberg Administrator
Bought by
Grinberg Laura and Grinberg Leonid
Purchase Details
Closed on
May 18, 2016
Sold by
Anthony J Lamberti As Trustee and Supplemental Needs Trust Of Sabrina Siro
Bought by
Estate Of Marina Sirota and Laura Grinberg As Administrator
Purchase Details
Closed on
Feb 17, 2009
Sold by
Marina Sirota and The Bank Of New York
Bought by
Marina Anthony J and Marina Sirota
Purchase Details
Closed on
Oct 12, 2006
Sold by
Fong Jeffrey and Fong Winnie
Bought by
Sirota Marina As Co-Trustee and The Bank Of New York As Co-Trustee
Purchase Details
Closed on
Jul 25, 2005
Sold by
Brighton Nine Llc
Bought by
Fong Jeffrey and Fong Winnie
Create a Home Valuation Report for This Property
The Home Valuation Report is an in-depth analysis detailing your home's value as well as a comparison with similar homes in the area
Home Values in the Area
Average Home Value in this Area
Purchase History
| Date | Buyer | Sale Price | Title Company |
|---|---|---|---|
| Grinberg Laura | -- | -- | |
| Grinberg Laura | -- | -- | |
| Grinberg Laura | -- | -- | |
| Estate Of Marina Sirota | -- | -- | |
| Marina Anthony J | -- | -- | |
| Sirota Marina As Co-Trustee | $800,000 | -- | |
| Fong Jeffrey | $717,866 | -- |
Source: Public Records
Tax History
| Year | Tax Paid | Tax Assessment Tax Assessment Total Assessment is a certain percentage of the fair market value that is determined by local assessors to be the total taxable value of land and additions on the property. | Land | Improvement |
|---|---|---|---|---|
| 2025 | $9,299 | $79,657 | $2,880 | $76,777 |
| 2024 | $9,299 | $87,723 | $2,880 | $84,843 |
| 2023 | $8,833 | $87,290 | $2,880 | $84,410 |
| 2022 | $6,319 | $78,615 | $2,880 | $75,735 |
| 2021 | $7,457 | $61,642 | $2,880 | $58,762 |
| 2020 | $6,328 | $66,134 | $2,880 | $63,254 |
| 2019 | $4,537 | $66,134 | $2,880 | $63,254 |
| 2018 | $2,978 | $65,811 | $2,880 | $62,931 |
| 2017 | $1,573 | $63,640 | $2,879 | $60,761 |
| 2016 | $360 | $47,537 | $2,879 | $44,658 |
| 2015 | $282 | $47,350 | $2,880 | $44,470 |
| 2014 | $282 | $48,692 | $2,879 | $45,813 |
Source: Public Records
About This Building
Map
Nearby Homes
- 105 Oceana Dr E Unit PH1D
- 155 Oceana Dr E Unit 4C
- 125 Oceana Dr E Unit PH1B
- 125 Oceana Dr E Unit 4F
- 135 Oceana Dr E Unit PH1D
- 75 Oceana Dr E Unit 1H
- 75 Oceana Dr E Unit 3G
- 35 Seacoast Terrace Unit 16D
- 35 Seacoast Terrace Unit 15C
- 35 Seacoast Terrace Unit 21F
- 35 Seacoast Terrace Unit 15U
- 35 Seacoast Terrace Unit 19S
- 35 Seacoast Terrace Unit 10N
- 35 Seacoast Terrace Unit 8A
- 35 Seacoast Terrace Unit 18B
- 35 Seacoast Terrace Unit 7E
- 35 Seacoast Terrace Unit 18V
- 35 Seacoast Terrace Unit 8D
- 35 Seacoast Terrace Unit 17F
- 35 Seacoast Terrace Unit 6G
- 135 Oceana Dr E Unit PH1C
- 135 Oceana Dr E Unit PH1B
- 135 Oceana Dr E Unit PH1A
- 135 Oceana Dr E Unit PH2D
- 135 Oceana Dr E Unit PH2C
- 135 Oceana Dr E Unit PH2B
- 135 Oceana Dr E Unit PH2A
- 135 Oceana Dr E Unit 6G
- 135 Oceana Dr E Unit 6F
- 135 Oceana Dr E Unit 6E
- 135 Oceana Dr E Unit 6D
- 135 Oceana Dr E Unit 6C
- 135 Oceana Dr E Unit 6B
- 135 Oceana Dr E Unit 5H
- 135 Oceana Dr E Unit 5G
- 135 Oceana Dr E Unit 5F
- 135 Oceana Dr E Unit 5E
- 135 Oceana Dr E Unit 5C
- 135 Oceana Dr E Unit 5B
- 135 Oceana Dr E Unit 5A