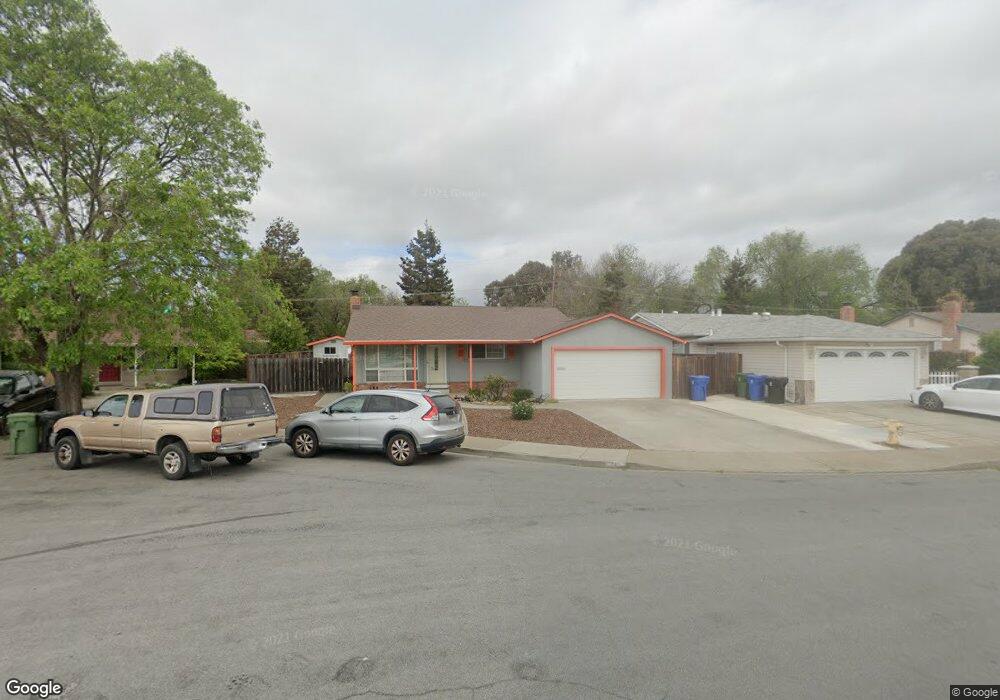
135 Peony Ct Fremont, CA 94538
Blacow NeighborhoodEstimated Value: $1,090,000 - $1,432,000
3
Beds
2
Baths
1,158
Sq Ft
$1,115/Sq Ft
Est. Value
About This Home
This home is located at 135 Peony Ct, Fremont, CA 94538 and is currently estimated at $1,291,747, approximately $1,115 per square foot. 135 Peony Ct is a home located in Alameda County with nearby schools including Steven Millard Elementary, G.M. Walters Middle School, and John F. Kennedy High School.
Ownership History
Date
Name
Owned For
Owner Type
Purchase Details
Closed on
Sep 14, 2024
Sold by
Yee Angie M and Yee Angie
Bought by
Angie M Yee Trust and Yee
Current Estimated Value
Purchase Details
Closed on
Oct 19, 2010
Sold by
Yee Angie M and Yee Angie
Bought by
Yee Angie M
Purchase Details
Closed on
May 20, 2009
Sold by
Punzalan Rommel and Punzalan Rosario C
Bought by
Yee Angie
Home Financials for this Owner
Home Financials are based on the most recent Mortgage that was taken out on this home.
Original Mortgage
$312,000
Interest Rate
4.82%
Mortgage Type
Purchase Money Mortgage
Purchase Details
Closed on
Mar 20, 2009
Sold by
Punzalan Rommel
Bought by
Punzalan Rommel and Punzalan Rosario C
Purchase Details
Closed on
Sep 25, 2007
Sold by
Punzalan Rocio
Bought by
Punzalan Rommel
Purchase Details
Closed on
Aug 15, 2007
Sold by
Punzalan Rosario C
Bought by
The Rosario C Punzalan Trust
Purchase Details
Closed on
Mar 14, 2007
Sold by
Green Ron F and Green Matilde A
Bought by
Punzalan Rosario C
Home Financials for this Owner
Home Financials are based on the most recent Mortgage that was taken out on this home.
Original Mortgage
$618,000
Interest Rate
7.75%
Mortgage Type
Purchase Money Mortgage
Purchase Details
Closed on
Mar 15, 2004
Sold by
Mooney Gerald B
Bought by
Green Ron F and Green Matilde A
Home Financials for this Owner
Home Financials are based on the most recent Mortgage that was taken out on this home.
Original Mortgage
$385,600
Interest Rate
6.4%
Mortgage Type
Purchase Money Mortgage
Purchase Details
Closed on
Mar 4, 2003
Sold by
Mooney Cinda L
Bought by
Mooney Gerald B
Home Financials for this Owner
Home Financials are based on the most recent Mortgage that was taken out on this home.
Original Mortgage
$341,600
Interest Rate
5.25%
Purchase Details
Closed on
Feb 19, 1997
Sold by
Adamshart Christopher and Adamshart Kristi
Bought by
Mooney Gerald B and Mooney Cinda L
Home Financials for this Owner
Home Financials are based on the most recent Mortgage that was taken out on this home.
Original Mortgage
$192,350
Interest Rate
7.86%
Purchase Details
Closed on
May 26, 1994
Sold by
Whitemyer Mark E and Whitemyer Kim R
Bought by
Adams Hart Christopher and Adams Hart Kristi
Home Financials for this Owner
Home Financials are based on the most recent Mortgage that was taken out on this home.
Original Mortgage
$148,400
Interest Rate
3.62%
Create a Home Valuation Report for This Property
The Home Valuation Report is an in-depth analysis detailing your home's value as well as a comparison with similar homes in the area
Home Values in the Area
Average Home Value in this Area
Purchase History
| Date | Buyer | Sale Price | Title Company |
|---|---|---|---|
| Angie M Yee Trust | -- | None Listed On Document | |
| Angie M Yee Trust | -- | None Listed On Document | |
| Yee Angie M | -- | Chicago Title Company | |
| Yee Angie | $390,000 | Fidelity National Title Co | |
| Punzalan Rommel | -- | Fidelity National Title Co | |
| Punzalan Rommel | -- | None Available | |
| Punzalan Rommel | -- | None Available | |
| The Rosario C Punzalan Trust | -- | None Available | |
| Punzalan Rosario C | $618,000 | Alliance Title Company | |
| Green Ron F | $482,000 | Fidelity National Title Co | |
| Mooney Gerald B | -- | First American Title Company | |
| Mooney Gerald B | $202,500 | Golden California Title Co | |
| Adams Hart Christopher | $165,000 | Chicago Title Company |
Source: Public Records
Mortgage History
| Date | Status | Borrower | Loan Amount |
|---|---|---|---|
| Previous Owner | Yee Angie | $312,000 | |
| Previous Owner | Punzalan Rosario C | $618,000 | |
| Previous Owner | Green Ron F | $385,600 | |
| Previous Owner | Mooney Gerald B | $341,600 | |
| Previous Owner | Mooney Gerald B | $192,350 | |
| Previous Owner | Adams Hart Christopher | $148,400 |
Source: Public Records
Tax History Compared to Growth
Tax History
| Year | Tax Paid | Tax Assessment Tax Assessment Total Assessment is a certain percentage of the fair market value that is determined by local assessors to be the total taxable value of land and additions on the property. | Land | Improvement |
|---|---|---|---|---|
| 2025 | $6,254 | $488,785 | $150,657 | $345,128 |
| 2024 | $6,254 | $479,067 | $147,704 | $338,363 |
| 2023 | $6,076 | $476,537 | $144,808 | $331,729 |
| 2022 | $5,983 | $460,197 | $141,970 | $325,227 |
| 2021 | $5,839 | $451,037 | $139,186 | $318,851 |
| 2020 | $5,811 | $453,343 | $137,760 | $315,583 |
| 2019 | $5,746 | $444,457 | $135,060 | $309,397 |
| 2018 | $5,631 | $435,744 | $132,412 | $303,332 |
| 2017 | $5,490 | $427,200 | $129,816 | $297,384 |
| 2016 | $5,389 | $418,826 | $127,271 | $291,555 |
| 2015 | $5,311 | $412,538 | $125,360 | $287,178 |
| 2014 | $5,214 | $404,461 | $122,906 | $281,555 |
Source: Public Records
Map
Nearby Homes
- 40422 Landon Ave
- 5341 Audubon Park Ct
- 5580 Hemlock Terrace
- 4840 Piper St
- 39997 Cedar Blvd Unit 153
- 39975 Cedar Blvd Unit 136
- 4860 Bryce Canyon Park Dr
- 4751 Wadsworth Ct
- 39857 Pelton Terrace
- 39887 Cedar Blvd Unit 253
- 39965 Potrero Dr
- 5589 Roosevelt Place
- 39850 Sundale Dr
- 40696 Robin St
- 39965 Parada St Unit A
- 4537 Capewood Terrace
- 4533 Capewood Terrace
- 6452 Buena Vista Dr
- 6204 Buena Vista Dr Unit B
- 6039 Joaquin Murieta Ave Unit B