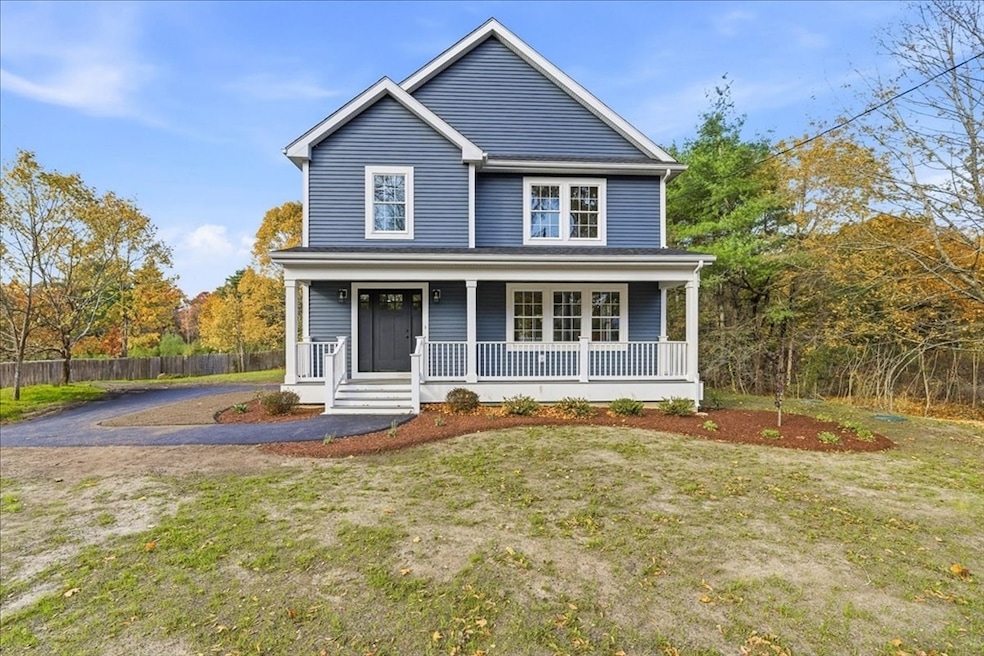
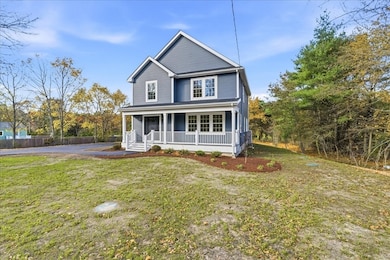
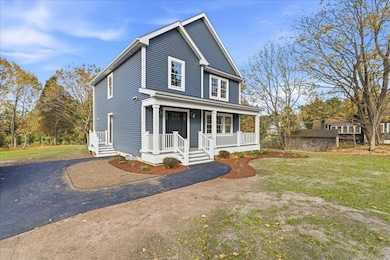
135 Plymouth St Carver, MA 02330
Estimated payment $4,324/month
Highlights
- Colonial Architecture
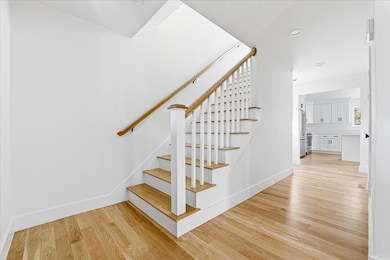
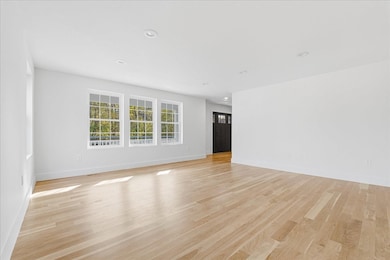
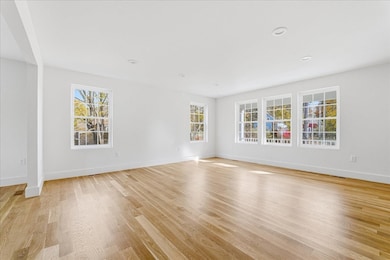
- Wood Flooring
- Porch
- Deck
- No HOA
- Cooling System Powered By Renewable Energy
About This Home
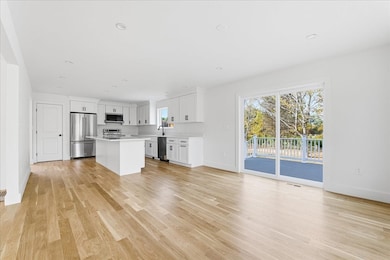
This New construction Colonial is awaiting its first owners. The heart of this home is undoubtedly the kitchen, featuring a large kitchen island that serves as a natural gathering spot, shaker cabinets that exude timeless elegance, granite countertops The Master bathroom has a walk-in shower that invites you to unwind and rejuvenate. The open floor plan creates a sense of spaciousness and connectivity, perfect for both entertaining and everyday living, while the porch offers a welcoming space to enjoy the outdoors.
Home Details
Home Type
- Single Family
Est. Annual Taxes
- $6,264
Year Built
- Built in 2025
Home Design
- Colonial Architecture
- Frame Construction
- Spray Foam Insulation
- Blown Fiberglass Insulation
- Asphalt Roof
- Concrete Perimeter Foundation
Interior Spaces
- 1,968 Sq Ft Home
- Insulated Windows
- Wood Flooring
- Basement Fills Entire Space Under The House
Kitchen
- Range
- ENERGY STAR Qualified Refrigerator
- Plumbed For Ice Maker
- ENERGY STAR Qualified Dishwasher
Bedrooms and Bathrooms
- 3 Bedrooms
- Primary bedroom located on second floor
Laundry
- Laundry on upper level
- Electric Dryer Hookup
Parking
- 4 Car Parking Spaces
- Driveway
- Open Parking
- Off-Street Parking
Outdoor Features
- Deck
- Porch
Schools
- CES Elementary School
- CMHS Middle School
- MMHS High School
Utilities
- Cooling System Powered By Renewable Energy
- Forced Air Heating and Cooling System
- 2 Cooling Zones
- 2 Heating Zones
- Air Source Heat Pump
- Ready for Renewables
- 200+ Amp Service
- Private Water Source
- Electric Water Heater
- Private Sewer
Additional Features
- ENERGY STAR Qualified Equipment for Heating
- 0.44 Acre Lot
Community Details
- No Home Owners Association
Listing and Financial Details
- Assessor Parcel Number 989962
Map
Home Values in the Area
Average Home Value in this Area
Tax History
| Year | Tax Paid | Tax Assessment Tax Assessment Total Assessment is a certain percentage of the fair market value that is determined by local assessors to be the total taxable value of land and additions on the property. | Land | Improvement |
|---|---|---|---|---|
| 2025 | $4,828 | $348,100 | $115,700 | $232,400 |
| 2024 | $4,567 | $322,300 | $113,400 | $208,900 |
| 2023 | $4,467 | $306,200 | $113,400 | $192,800 |
| 2022 | $4,558 | $274,700 | $107,800 | $166,900 |
| 2021 | $4,262 | $251,600 | $101,000 | $150,600 |
| 2020 | $4,561 | $236,000 | $94,400 | $141,600 |
| 2019 | $2,412 | $229,600 | $91,700 | $137,900 |
| 2018 | $3,812 | $216,200 | $91,700 | $124,500 |
| 2017 | $3,483 | $196,900 | $84,000 | $112,900 |
| 2016 | $3,202 | $188,000 | $80,000 | $108,000 |
| 2015 | $3,123 | $183,600 | $80,000 | $103,600 |
| 2014 | $3,189 | $187,500 | $101,100 | $86,400 |
Property History
| Date | Event | Price | List to Sale | Price per Sq Ft |
|---|---|---|---|---|
| 11/15/2025 11/15/25 | For Sale | $724,900 | -- | $368 / Sq Ft |
Purchase History
| Date | Type | Sale Price | Title Company |
|---|---|---|---|
| Foreclosure Deed | $50,000 | None Available | |
| Quit Claim Deed | -- | -- |
Mortgage History
| Date | Status | Loan Amount | Loan Type |
|---|---|---|---|
| Open | $287,000 | Purchase Money Mortgage |
Source: MLS Property Information Network (MLS PIN)
MLS Number: 73455253
APN: CARV-000019-000000-000051
Disclaimer: Certain information contained herein is derived from information provided by parties other than Homes.com. All information provided is deemed reliable, but is not guaranteed to be accurate and should be independently verified.
![]() The property listing data and information, or the Images, set forth herein were provided to MLS Property Information Network, Inc. from third party sources, including sellers, lessors and public records, and were compiled by MLS Property Information Network, Inc. The property listing data and information, and the Images, are for the personal, non-commercial use of consumers having a good faith interest in purchasing or leasing listed properties of the type displayed to them and may not be used for any purpose other than to identify prospective properties which such consumers may have a good faith interest in purchasing or leasing. MLS Property Information Network, Inc. and its subscribers disclaim any and all representations and warranties as to the accuracy of the property listing data and information, or as to the accuracy of any of the Images, set forth herein.
The property listing data and information, or the Images, set forth herein were provided to MLS Property Information Network, Inc. from third party sources, including sellers, lessors and public records, and were compiled by MLS Property Information Network, Inc. The property listing data and information, and the Images, are for the personal, non-commercial use of consumers having a good faith interest in purchasing or leasing listed properties of the type displayed to them and may not be used for any purpose other than to identify prospective properties which such consumers may have a good faith interest in purchasing or leasing. MLS Property Information Network, Inc. and its subscribers disclaim any and all representations and warranties as to the accuracy of the property listing data and information, or as to the accuracy of any of the Images, set forth herein.
- 11 Brockton Ave
- 7 Green St
- 6 Susan Cir
- 26 Santana Way Unit 26
- 35 Silva St
- 23 Shaw St
- 122 High St
- 64 Wenham Rd
- 6 Kestrel Way
- 20 Spring St
- 81 Center St
- 0 Spring St
- Lot1 Elk Run Dr
- 6 Twin Pines Ln Unit 6
- 38 Cedar Dr
- 14 Cushman Landing
- 141 Rocky Meadow St
- 25 Dukes Brook Rd
- 5 Carver Square Blvd Unit 5
- 5 Carver Square Blvd
- 38 N Main St Unit 2R
- 5 Santana Way Unit 5
- 50 Pleasant St Unit 1
- 50 Pleasant Street - Short Term Unit 1
- 87 Center St
- 55 Wenham Rd
- 9 Russell Holmes Way Unit 2
- 684 Plymouth St Unit 2
- 214B Main St
- 25 Plaza Way
- 32 Paul Francis Way
- 6 Squire Way
- 1 Kingston Collection Way
- 34 Wapping Rd Unit 1
- 10 Glacier Path Unit 10
- 31 E Main St
- 12 Glacier Path Unit 12
- 480 Wareham St Unit 16
- 480 Wareham St Unit 10
- 480 Wareham St Unit 6
