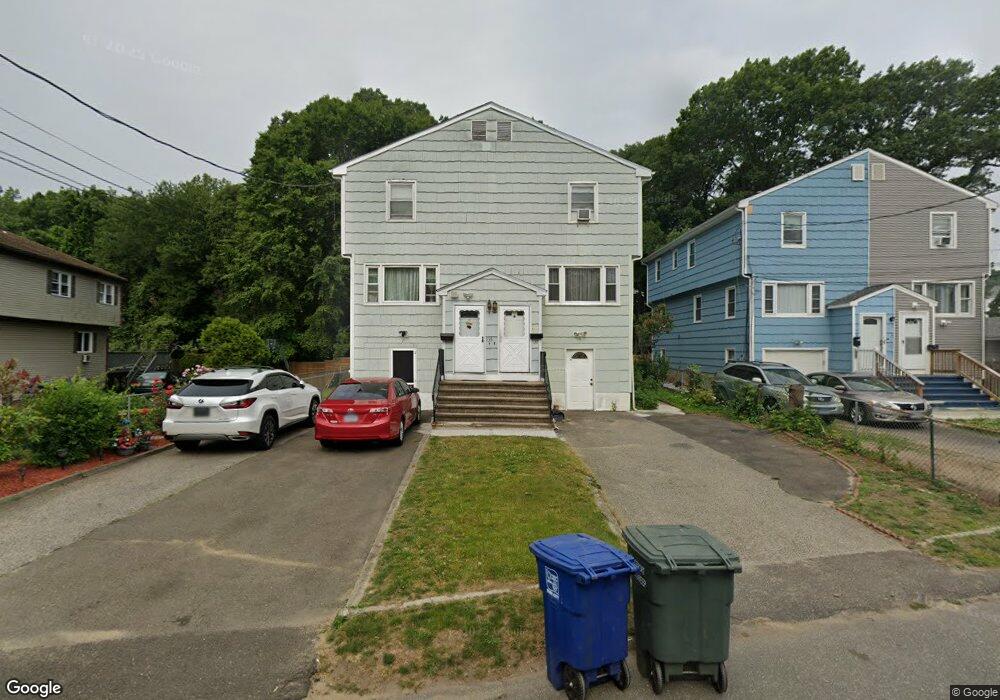
135 Pond St Bridgeport, CT 06606
Reservoir-Whiskey Hill NeighborhoodEstimated Value: $329,000 - $401,000
3
Beds
2
Baths
1,260
Sq Ft
$284/Sq Ft
Est. Value
About This Home
This home is located at 135 Pond St, Bridgeport, CT 06606 and is currently estimated at $357,495, approximately $283 per square foot. 135 Pond St is a home located in Fairfield County with nearby schools including Read School, Central High School, and Northeastern Adventist Academy - Fairfield County.
Ownership History
Date
Name
Owned For
Owner Type
Purchase Details
Closed on
Sep 30, 2003
Sold by
Soto Nelson and Soto Maria M
Bought by
Resto Marie L and Resto Jasmin
Current Estimated Value
Home Financials for this Owner
Home Financials are based on the most recent Mortgage that was taken out on this home.
Original Mortgage
$150,000
Outstanding Balance
$63,693
Interest Rate
6.29%
Estimated Equity
$293,802
Create a Home Valuation Report for This Property
The Home Valuation Report is an in-depth analysis detailing your home's value as well as a comparison with similar homes in the area
Home Values in the Area
Average Home Value in this Area
Purchase History
| Date | Buyer | Sale Price | Title Company |
|---|---|---|---|
| Resto Marie L | $153,000 | -- | |
| Resto Marie L | $153,000 | -- |
Source: Public Records
Mortgage History
| Date | Status | Borrower | Loan Amount |
|---|---|---|---|
| Open | Resto Marie L | $150,000 | |
| Closed | Resto Marie L | $150,000 | |
| Previous Owner | Resto Marie L | $72,000 | |
| Previous Owner | Resto Marie L | $16,370 |
Source: Public Records
Tax History Compared to Growth
Tax History
| Year | Tax Paid | Tax Assessment Tax Assessment Total Assessment is a certain percentage of the fair market value that is determined by local assessors to be the total taxable value of land and additions on the property. | Land | Improvement |
|---|---|---|---|---|
| 2025 | $7,014 | $161,431 | $41,271 | $120,160 |
| 2024 | $7,014 | $161,431 | $41,271 | $120,160 |
| 2023 | $7,014 | $161,431 | $41,271 | $120,160 |
| 2022 | $7,014 | $161,431 | $41,271 | $120,160 |
| 2021 | $7,014 | $161,431 | $41,271 | $120,160 |
| 2020 | $5,425 | $100,490 | $25,030 | $75,460 |
| 2019 | $5,425 | $100,490 | $25,030 | $75,460 |
| 2018 | $5,464 | $100,490 | $25,030 | $75,460 |
| 2017 | $5,464 | $100,490 | $25,030 | $75,460 |
| 2016 | $5,464 | $100,490 | $25,030 | $75,460 |
| 2015 | $5,070 | $120,140 | $25,250 | $94,890 |
| 2014 | $5,070 | $120,140 | $25,250 | $94,890 |
Source: Public Records
Map
Nearby Homes
- 39 Infield St
- 235 Indian Ave
- 245 Indian Ave
- 138 Infield St
- 355 Chamberlain Ave
- 385 Chamberlain Ave
- 926 Hart St
- 916 Hart St
- 936 Lindley St
- 330 Oakwood St
- 1265 Lindley St
- 45 Polk St
- 123 Exeter St
- 5 Stevens St
- 45 Stevens St Unit 2
- 355 Exeter St
- 213 Exeter St
- 219 Exeter St
- 178 Island Brook Ave
- 330 French St