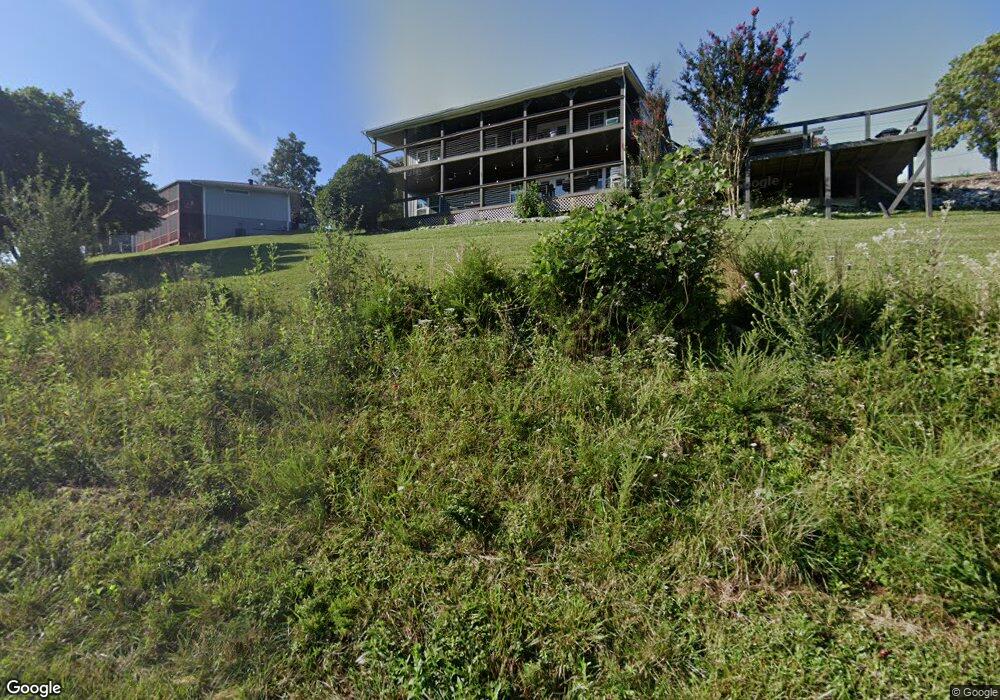
135 Reflection Ln La Follette, TN 37766
Estimated Value: $611,000 - $848,000
--
Bed
4
Baths
2,880
Sq Ft
$240/Sq Ft
Est. Value
About This Home
This home is located at 135 Reflection Ln, La Follette, TN 37766 and is currently estimated at $689,764, approximately $239 per square foot. 135 Reflection Ln is a home located in Campbell County.
Ownership History
Date
Name
Owned For
Owner Type
Purchase Details
Closed on
Nov 26, 2019
Sold by
Corey Jeff
Bought by
Standifer Edward
Current Estimated Value
Purchase Details
Closed on
Jul 25, 2019
Sold by
Campbell Of County
Bought by
Marcum Kristina and Marcum Robert Lee
Home Financials for this Owner
Home Financials are based on the most recent Mortgage that was taken out on this home.
Original Mortgage
$149,000
Interest Rate
3.73%
Mortgage Type
New Conventional
Purchase Details
Closed on
Jun 23, 1995
Sold by
Drees William
Bought by
Crawford William
Purchase Details
Closed on
Feb 2, 1990
Bought by
Marcum Joe Mona
Purchase Details
Closed on
Aug 3, 1984
Bought by
Fields Paul R and Fields Madeline
Purchase Details
Closed on
Jul 14, 1982
Purchase Details
Closed on
Jan 4, 1900
Purchase Details
Closed on
Jan 3, 1900
Create a Home Valuation Report for This Property
The Home Valuation Report is an in-depth analysis detailing your home's value as well as a comparison with similar homes in the area
Home Values in the Area
Average Home Value in this Area
Purchase History
| Date | Buyer | Sale Price | Title Company |
|---|---|---|---|
| Standifer Edward | $93,500 | Republic Title Agency Inc | |
| Marcum Kristina | $187,000 | None Available | |
| Crawford William | $22,500 | -- | |
| Marcum Joe Mona | -- | -- | |
| Fields Paul R | -- | -- | |
| -- | -- | -- | |
| -- | -- | -- | |
| -- | -- | -- |
Source: Public Records
Mortgage History
| Date | Status | Borrower | Loan Amount |
|---|---|---|---|
| Previous Owner | Marcum Kristina | $149,000 |
Source: Public Records
Tax History Compared to Growth
Tax History
| Year | Tax Paid | Tax Assessment Tax Assessment Total Assessment is a certain percentage of the fair market value that is determined by local assessors to be the total taxable value of land and additions on the property. | Land | Improvement |
|---|---|---|---|---|
| 2025 | $1,308 | $107,575 | $0 | $0 |
| 2024 | $1,308 | $107,575 | $10,900 | $96,675 |
| 2023 | $1,120 | $54,225 | $5,450 | $48,775 |
| 2022 | $1,120 | $54,225 | $5,450 | $48,775 |
| 2021 | $1,120 | $54,225 | $5,450 | $48,775 |
| 2020 | $1,098 | $54,225 | $5,450 | $48,775 |
| 2019 | $1,120 | $54,225 | $5,450 | $48,775 |
| 2018 | $980 | $43,575 | $2,500 | $41,075 |
| 2017 | $980 | $43,575 | $2,500 | $41,075 |
| 2016 | $980 | $43,575 | $2,500 | $41,075 |
| 2015 | $867 | $43,575 | $2,500 | $41,075 |
| 2014 | $867 | $43,575 | $2,500 | $41,075 |
| 2013 | -- | $43,575 | $2,500 | $41,075 |
Source: Public Records
Map
Nearby Homes
- 309 Alder Shore Ln
- 150 E Harbor View Ln
- 118 E Harbor View Ln Unit A
- 118 E Harbor View Ln Unit B
- 135 N Deer Hill Village Ln Unit A
- 131 N Deer Village Ln Unit B
- 207 N Deer Hill Village Unit A
- 195 N Deer Village Ln Unit B
- 163 N Deer Village Ln
- 117 W Deer Hill Village Ln
- 0 Lakesprings Dr Unit 1315301
- 0 Antlers Way Unit 1260064
- 245 Doe Ln Unit 5
- 195 Kennedys Loop
- Lot 8 Chapman Rd
- Lot 3 Chapman Rd
- Lot 2 Chapman Rd
- Lot 7 Chapman Rd
- Lot 6 Chapman Rd
- Lot 9 Chapman Rd
- 141 Reflection Ln
- 511 Alder Shore Ln
- 0 Brandt Pike Unit 1187385
- 165 Lake Springs Dr
- 159 Reflection Ln
- 0 Buoy Ln Unit 679052
- 0 Buoy Ln Unit 722525
- 0 Buoy Ln Unit 747921
- 0 Buoy Ln Unit 795452
- 0 Buoy Ln Unit 819991
- 0 Buoy Ln Unit 927618
- 0 Buoy Ln Unit 948080
- 0 Buoy Ln Unit 835910
- 512 Alder Shore Ln
- 512 Alder Shore Ln
- 512 Alder Shore Ln
- 512 Alder Shore Ln
- 512 Alder Shore Ln
- 487 Lakesprings Dr Unit 3c
- 487 Lakesprings Dr Unit B3