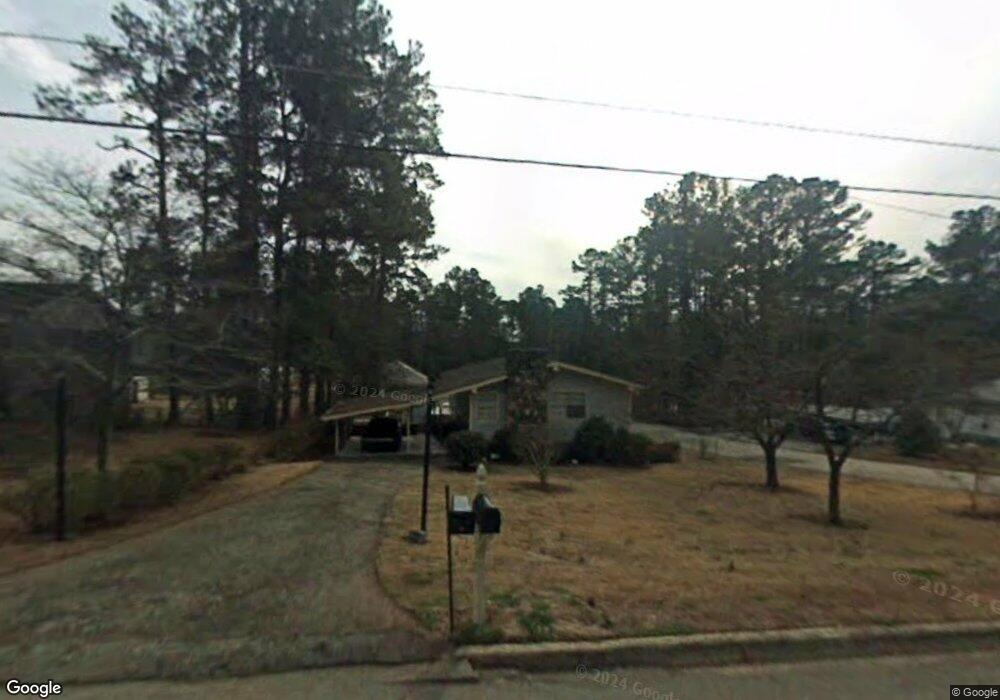
135 S Chilton Crescent Lagrange, GA 30240
Estimated Value: $199,022 - $214,000
3
Beds
3
Baths
1,064
Sq Ft
$195/Sq Ft
Est. Value
About This Home
This home is located at 135 S Chilton Crescent, Lagrange, GA 30240 and is currently estimated at $208,006, approximately $195 per square foot. 135 S Chilton Crescent is a home located in Troup County with nearby schools including Franklin Forest Elementary School, Hollis Hand Elementary School, and Ethel W. Kight Elementary School.
Ownership History
Date
Name
Owned For
Owner Type
Purchase Details
Closed on
May 17, 2019
Sold by
Hutchinson Investments Llc
Bought by
Rush Brandi L
Current Estimated Value
Home Financials for this Owner
Home Financials are based on the most recent Mortgage that was taken out on this home.
Original Mortgage
$109,890
Outstanding Balance
$96,419
Interest Rate
4.1%
Mortgage Type
New Conventional
Estimated Equity
$111,587
Purchase Details
Closed on
Oct 29, 2014
Sold by
Edwards Elizabeth
Bought by
Hutchinson Investments Llc
Purchase Details
Closed on
Mar 19, 2003
Sold by
Pamela J Moore
Bought by
Edwards John and Edwards Elizabeth
Purchase Details
Closed on
Feb 16, 1996
Sold by
Sara R Richards By Ex
Bought by
Pamela J Moore
Purchase Details
Closed on
Jul 2, 1979
Sold by
Richards George E
Bought by
Sara R Richards By Ex
Purchase Details
Closed on
Jun 1, 1966
Sold by
Bungalow Builders
Bought by
Richards George E
Create a Home Valuation Report for This Property
The Home Valuation Report is an in-depth analysis detailing your home's value as well as a comparison with similar homes in the area
Home Values in the Area
Average Home Value in this Area
Purchase History
| Date | Buyer | Sale Price | Title Company |
|---|---|---|---|
| Rush Brandi L | $108,000 | -- | |
| Hutchinson Investments Llc | $47,500 | -- | |
| Edwards John | $88,000 | -- | |
| Pamela J Moore | $60,000 | -- | |
| Sara R Richards By Ex | -- | -- | |
| Richards George E | -- | -- |
Source: Public Records
Mortgage History
| Date | Status | Borrower | Loan Amount |
|---|---|---|---|
| Open | Rush Brandi L | $109,890 |
Source: Public Records
Tax History Compared to Growth
Tax History
| Year | Tax Paid | Tax Assessment Tax Assessment Total Assessment is a certain percentage of the fair market value that is determined by local assessors to be the total taxable value of land and additions on the property. | Land | Improvement |
|---|---|---|---|---|
| 2024 | $1,874 | $68,704 | $4,360 | $64,344 |
| 2023 | $1,487 | $54,528 | $4,360 | $50,168 |
| 2022 | $1,458 | $52,248 | $4,360 | $47,888 |
| 2021 | $1,132 | $37,520 | $4,360 | $33,160 |
| 2020 | $1,132 | $37,520 | $4,360 | $33,160 |
| 2019 | $789 | $26,160 | $4,360 | $21,800 |
| 2018 | $784 | $26,000 | $4,200 | $21,800 |
| 2017 | $784 | $26,000 | $4,200 | $21,800 |
| 2016 | $764 | $25,332 | $4,200 | $21,132 |
| 2015 | $574 | $19,000 | $3,263 | $15,737 |
| 2014 | $773 | $25,561 | $4,382 | $21,180 |
| 2013 | -- | $26,707 | $4,412 | $22,295 |
Source: Public Records
Map
Nearby Homes
- 201 S Chilton Crescent
- 203 S Chilton Crescent
- 106 S Chilton Crescent
- 724 Camellia Dr
- 106 Ewing St
- 102 Ewing St
- 100 Creekside Dr Unit LOT 60A
- 107 Dixie Creek Dr
- 748 Lakewood Dr
- 145 Turner St
- 204 Colonial St
- 110 Russell St
- 900 North St
- 806 New Franklin Rd
- 114 Briarcliff Rd
- 109 Thomas St
- 219 Banks St
- 705 Piney Woods Dr
- 134 S Page St
- 127 Ashling Dr
- 133 S Chilton Crescent
- 145 Marlboro Way
- 100 Chesterfield Place
- 131 S Chilton Crescent
- 136 S Chilton Crescent
- 138 S Chilton Crescent
- 948 Malibu Dr
- 132 S Chilton Crescent
- 202 Chesterfield Place
- 125 S Chilton Crescent
- 946 Malibu Dr
- 204 S Chitlon Crescent
- 204 S Chilton Crescent
- 201 Chesterfield Place
- 205 S Chilton Crescent
- 128 S Chilton Crescent
- 127 N Chilton Crescent
- 944 Malibu Dr
- 201 N Chilton Crescent
- 208 Chesterfield Place