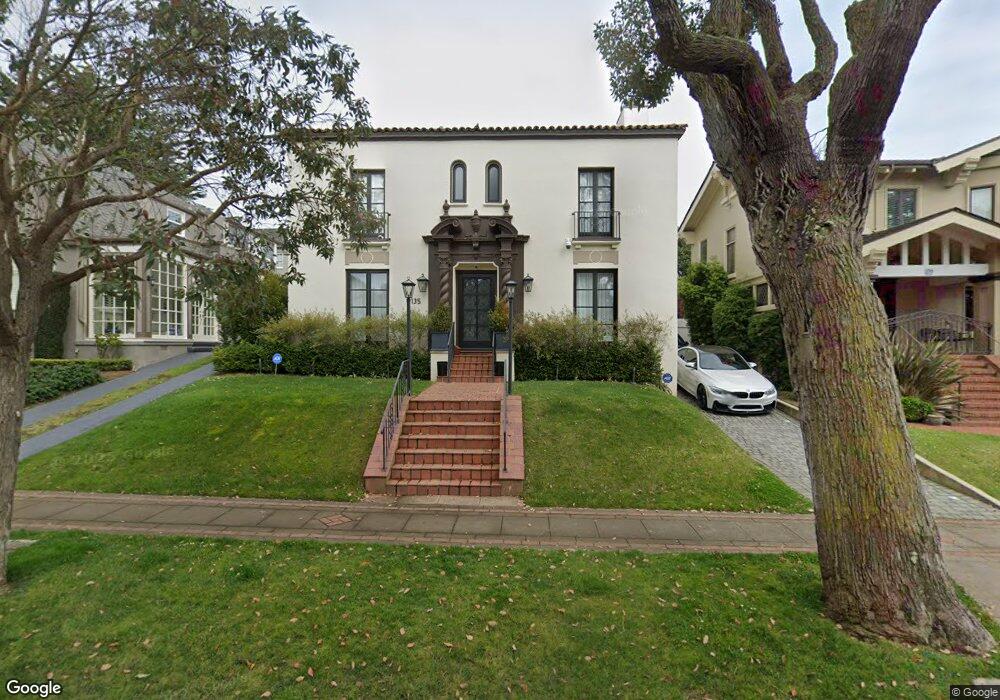
135 San Leandro Way San Francisco, CA 94127
Saint Francis Wood NeighborhoodEstimated Value: $3,256,000 - $4,646,000
4
Beds
3
Baths
2,931
Sq Ft
$1,337/Sq Ft
Est. Value
About This Home
This home is located at 135 San Leandro Way, San Francisco, CA 94127 and is currently estimated at $3,917,915, approximately $1,336 per square foot. 135 San Leandro Way is a home located in San Francisco County with nearby schools including Miraloma Elementary School, Denman (James) Middle School, and St. Stephen School.
Ownership History
Date
Name
Owned For
Owner Type
Purchase Details
Closed on
Dec 3, 2014
Sold by
Smith Raymond L and Delgadillo Ofelia M
Bought by
Liu William
Current Estimated Value
Purchase Details
Closed on
Jul 16, 2012
Sold by
Denebeim Anne Kelny
Bought by
Smith Raymond L and Delgadillo Ofelia M
Home Financials for this Owner
Home Financials are based on the most recent Mortgage that was taken out on this home.
Original Mortgage
$1,200,000
Interest Rate
2.75%
Mortgage Type
New Conventional
Purchase Details
Closed on
Oct 29, 2002
Sold by
Denebeim Bruce K and Denebem Beverley B
Bought by
Denebeim Bruce Kelny and Denebeim Beverley Bellamy
Purchase Details
Closed on
Sep 25, 1993
Sold by
Denebeim Bruce K and Denebeim Beverley B
Bought by
Denebeim Bruce K and Denebeim Beverley B
Home Financials for this Owner
Home Financials are based on the most recent Mortgage that was taken out on this home.
Original Mortgage
$80,000
Interest Rate
6.94%
Create a Home Valuation Report for This Property
The Home Valuation Report is an in-depth analysis detailing your home's value as well as a comparison with similar homes in the area
Home Values in the Area
Average Home Value in this Area
Purchase History
| Date | Buyer | Sale Price | Title Company |
|---|---|---|---|
| Liu William | $2,908,000 | Fidelity National Title Co | |
| Smith Raymond L | $2,250,000 | Old Republic Title Company | |
| Denebeim Bruce Kelny | -- | -- | |
| Denebeim Bruce K | -- | Commonwealth Title Company |
Source: Public Records
Mortgage History
| Date | Status | Borrower | Loan Amount |
|---|---|---|---|
| Previous Owner | Smith Raymond L | $1,200,000 | |
| Previous Owner | Denebeim Bruce K | $80,000 |
Source: Public Records
Tax History Compared to Growth
Tax History
| Year | Tax Paid | Tax Assessment Tax Assessment Total Assessment is a certain percentage of the fair market value that is determined by local assessors to be the total taxable value of land and additions on the property. | Land | Improvement |
|---|---|---|---|---|
| 2025 | $47,749 | $4,088,914 | $2,446,481 | $1,642,433 |
| 2024 | $47,749 | $4,008,741 | $2,398,511 | $1,610,230 |
| 2023 | $47,051 | $3,930,140 | $2,351,482 | $1,578,658 |
| 2022 | $46,189 | $3,853,080 | $2,305,375 | $1,547,705 |
| 2021 | $45,382 | $3,777,531 | $2,260,172 | $1,517,359 |
| 2020 | $45,598 | $3,738,798 | $2,236,997 | $1,501,801 |
| 2019 | $43,977 | $3,665,490 | $2,193,135 | $1,472,355 |
| 2018 | $40,713 | $3,440,619 | $2,150,133 | $1,290,486 |
| 2017 | $35,988 | $3,061,392 | $2,107,974 | $953,418 |
| 2016 | $35,166 | $2,952,346 | $2,066,642 | $885,704 |
| 2015 | $34,735 | $2,908,000 | $2,035,600 | $872,400 |
| 2014 | $26,798 | $2,260,214 | $1,582,150 | $678,064 |
Source: Public Records
Map
Nearby Homes
- 95 Junipero Serra Blvd
- 1475 Monterey Blvd
- 110 Santa Clara Ave
- 245 Westgate Dr
- 44 Yerba Buena Ave
- 75 San Jacinto Way
- 345 Moncada Way
- 760 Darien Way
- 2978 20th Ave
- 160 Wawona St
- 92 San Pablo Ave
- 850 Darien Way
- 185 Upland Dr
- 2 Westgate Dr
- 150 Upland Dr
- 155 Upland Dr
- 55 Upland Dr
- 270 Claremont Blvd
- 40 Dorchester Way
- 72 Cresta Vista Dr
- 125 San Leandro Way
- 139 San Leandro Way
- 130 Santa Ana Ave
- 115 San Leandro Way
- 155 San Leandro Way
- 110 Santa Ana Ave
- 150 Santa Ana Ave
- 130 San Leandro Way
- 163 San Leandro Way
- 140 San Leandro Way
- 120 San Leandro Way
- 200 Saint Francis Blvd
- 160 Santa Ana Ave
- 240 Saint Francis Blvd
- 150 San Leandro Way
- 110 San Leandro Way
- 175 San Leandro Way
- 170 Santa Ana Ave
- 160 San Leandro Way
- 136 Saint Francis Blvd