135 Shoreline Place Vallejo, CA 94591
Glen Cove NeighborhoodEstimated Value: $744,957 - $859,000
5
Beds
3
Baths
2,846
Sq Ft
$277/Sq Ft
Est. Value
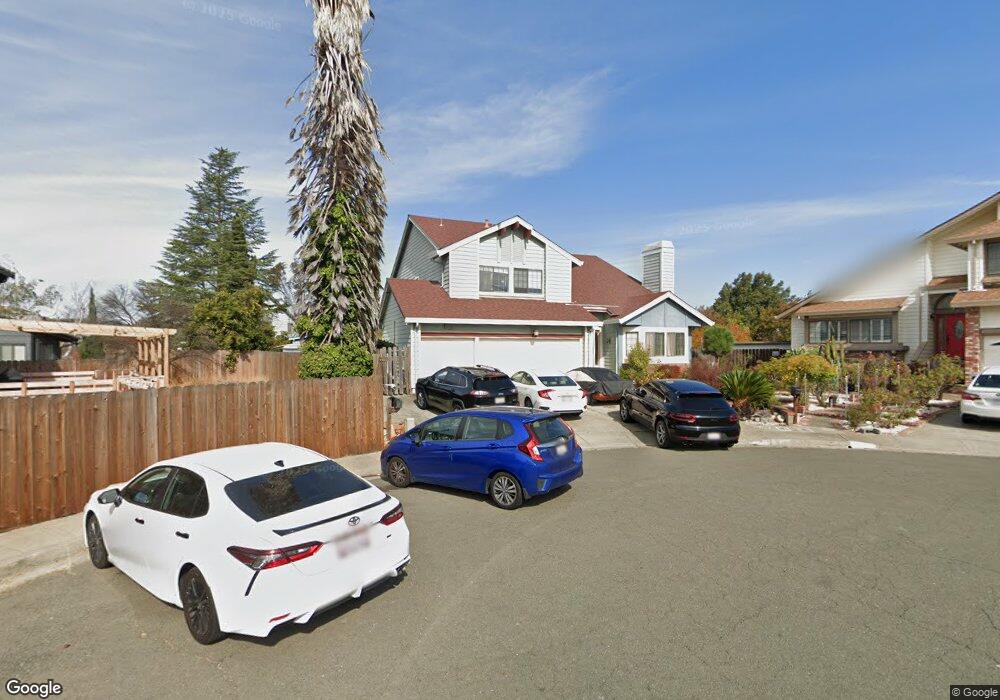
About This Home
This home is located at 135 Shoreline Place, Vallejo, CA 94591 and is currently estimated at $787,239, approximately $276 per square foot. 135 Shoreline Place is a home located in Solano County with nearby schools including Glen Cove Elementary, Jesse M. Bethel High School, and Vallejo Charter School.
Ownership History
Date
Name
Owned For
Owner Type
Purchase Details
Closed on
Apr 8, 2010
Sold by
Mateo Larry C and Mateo Rufina C V
Bought by
Mateo Larry C and Mateo Rufina C V
Current Estimated Value
Home Financials for this Owner
Home Financials are based on the most recent Mortgage that was taken out on this home.
Original Mortgage
$270,000
Interest Rate
4.18%
Mortgage Type
New Conventional
Purchase Details
Closed on
Feb 23, 2005
Sold by
Mateo Larry C and Mateo Rufina C V
Bought by
Mateo Larry C and Mateo Rufina C V
Purchase Details
Closed on
Nov 20, 2001
Sold by
Mateo Larry C and Mateo Ruffina C V
Bought by
Mateo Larry C and Mateo Ruffina C V
Home Financials for this Owner
Home Financials are based on the most recent Mortgage that was taken out on this home.
Original Mortgage
$225,000
Interest Rate
6.63%
Purchase Details
Closed on
Dec 22, 1999
Sold by
Mateo Larry C and Mateo Rufina C
Bought by
Mateo Larry C and Mateo Rufina C V
Create a Home Valuation Report for This Property
The Home Valuation Report is an in-depth analysis detailing your home's value as well as a comparison with similar homes in the area
Home Values in the Area
Average Home Value in this Area
Purchase History
| Date | Buyer | Sale Price | Title Company |
|---|---|---|---|
| Mateo Larry C | -- | Placer Title Company | |
| Mateo Larry C | -- | Placer Title Company | |
| Mateo Larry C | -- | -- | |
| Mateo Larry C | -- | First American Title Ins Co | |
| Mateo Larry C | -- | -- |
Source: Public Records
Mortgage History
| Date | Status | Borrower | Loan Amount |
|---|---|---|---|
| Closed | Mateo Larry C | $270,000 | |
| Closed | Mateo Larry C | $225,000 |
Source: Public Records
Tax History Compared to Growth
Tax History
| Year | Tax Paid | Tax Assessment Tax Assessment Total Assessment is a certain percentage of the fair market value that is determined by local assessors to be the total taxable value of land and additions on the property. | Land | Improvement |
|---|---|---|---|---|
| 2025 | $6,389 | $454,714 | $149,756 | $304,958 |
| 2024 | $6,389 | $445,799 | $146,820 | $298,979 |
| 2023 | $6,078 | $437,059 | $143,942 | $293,117 |
| 2022 | $5,990 | $428,490 | $141,120 | $287,370 |
| 2021 | $5,846 | $420,089 | $138,353 | $281,736 |
| 2020 | $5,885 | $415,783 | $136,935 | $278,848 |
| 2019 | $5,727 | $407,631 | $134,250 | $273,381 |
| 2018 | $5,383 | $399,639 | $131,618 | $268,021 |
| 2017 | $5,167 | $391,804 | $129,038 | $262,766 |
| 2016 | $4,595 | $384,122 | $126,508 | $257,614 |
| 2015 | $4,533 | $378,353 | $124,608 | $253,745 |
| 2014 | $4,372 | $370,943 | $122,168 | $248,775 |
Source: Public Records
Map
Nearby Homes
- 100 Shoreline Place
- 173 Silverpine Ln
- 180 Winter Harbor Place
- 1048 Topsail Dr
- 1259 Fulton Ave
- 115 Lands End Ct Unit 26
- 100 Bear Cove Ct
- 13 Aspen Ct
- 1118 Bush Ave
- 118 Hydrangea Ct
- 124 Hydrangea Ct
- 783 Pueblo Way
- 108 Sunnyglen Dr
- 28 Shoal Dr E
- 130 Flying Cloud Ct
- Plan 7 at Cascade at Waterstone
- Plan 3 at Cascade at Waterstone
- Plan 1 at Cascade at Waterstone
- Plan 2 at Cascade at Waterstone
- Plan 4 at Cascade at Waterstone
- 183 Shoreline Place
- 438 Fairhaven Way
- 462 Fairhaven Way
- 210 Redbud Ln
- 508 Robles Way
- 109 Silverpine Ln
- 414 Fairhaven Way
- 117 Silverpine Ln
- 178 Shoreline Place
- 500 Robles Way
- 134 Shoreline Place
- 133 Silverpine Ln
- 141 Silverpine Ln
- 449 Fairhaven Way
- 501 Fairhaven Way
- 413 Fairhaven Way
- 108 Silverpine Ln
- 509 Robles Way
- 116 Silverpine Ln