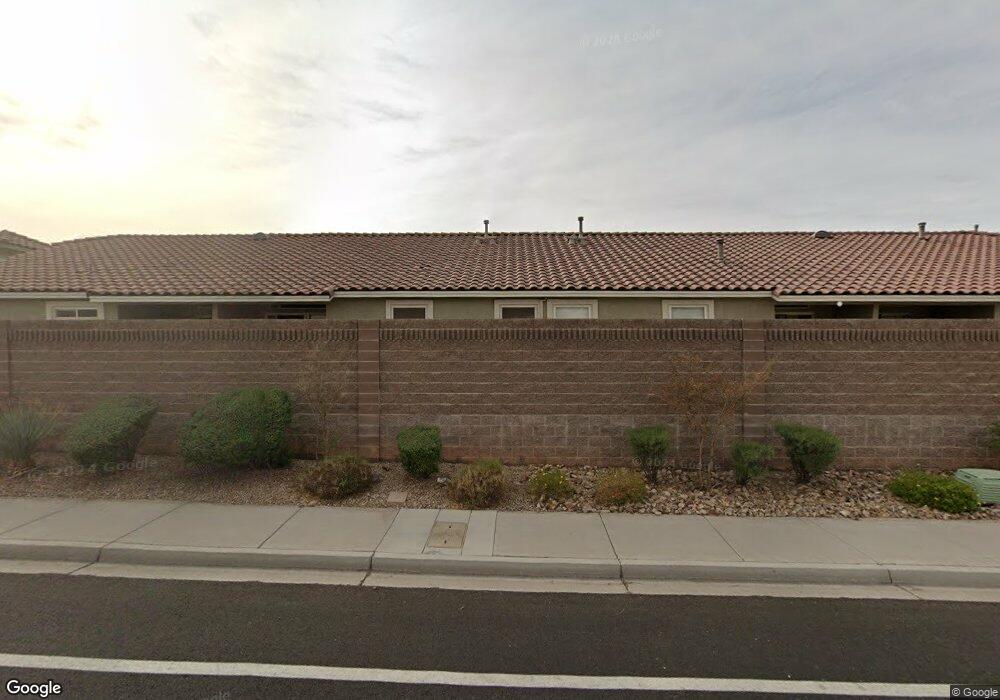
135 Tapatio St Henderson, NV 89074
Green Valley South NeighborhoodEstimated Value: $338,000 - $345,000
2
Beds
2
Baths
1,220
Sq Ft
$279/Sq Ft
Est. Value
About This Home
This home is located at 135 Tapatio St, Henderson, NV 89074 and is currently estimated at $340,909, approximately $279 per square foot. 135 Tapatio St is a home located in Clark County with nearby schools including Aggie Roberts Elementary School, Jack Lund Schofield Middle School, and Silverado High School.
Ownership History
Date
Name
Owned For
Owner Type
Purchase Details
Closed on
Nov 9, 2022
Sold by
Spade Denise L
Bought by
Spade Denise L and Brown Tiffany Rene
Current Estimated Value
Purchase Details
Closed on
Oct 20, 2022
Sold by
Perry Myrna Lee
Bought by
Spade Denise L
Purchase Details
Closed on
Mar 9, 2020
Sold by
Lyons Corinne and Brod Susan
Bought by
Perry Myrna Lee
Purchase Details
Closed on
Jul 15, 2006
Sold by
Korbol Linda S
Bought by
Lyons Corinne and Brod Susan
Home Financials for this Owner
Home Financials are based on the most recent Mortgage that was taken out on this home.
Original Mortgage
$183,750
Interest Rate
6.57%
Mortgage Type
Unknown
Purchase Details
Closed on
Jun 16, 1995
Sold by
Wigwam Associates Ltd Partnership
Bought by
Korbol Linda S
Home Financials for this Owner
Home Financials are based on the most recent Mortgage that was taken out on this home.
Original Mortgage
$108,850
Interest Rate
8.37%
Create a Home Valuation Report for This Property
The Home Valuation Report is an in-depth analysis detailing your home's value as well as a comparison with similar homes in the area
Home Values in the Area
Average Home Value in this Area
Purchase History
| Date | Buyer | Sale Price | Title Company |
|---|---|---|---|
| Spade Denise L | -- | -- | |
| Spade Denise L | $345,000 | Wfg National Title | |
| Perry Myrna Lee | $252,000 | Lawyers Title Las Vegas | |
| Lyons Corinne | $245,000 | Equity Title Of Nevada | |
| Korbol Linda S | $115,000 | United Title |
Source: Public Records
Mortgage History
| Date | Status | Borrower | Loan Amount |
|---|---|---|---|
| Previous Owner | Lyons Corinne | $183,750 | |
| Previous Owner | Korbol Linda S | $108,850 |
Source: Public Records
Tax History Compared to Growth
Tax History
| Year | Tax Paid | Tax Assessment Tax Assessment Total Assessment is a certain percentage of the fair market value that is determined by local assessors to be the total taxable value of land and additions on the property. | Land | Improvement |
|---|---|---|---|---|
| 2025 | $1,236 | $74,163 | $27,650 | $46,513 |
| 2024 | $1,146 | $74,163 | $27,650 | $46,513 |
| 2023 | $1,146 | $76,181 | $33,250 | $42,931 |
| 2022 | $1,061 | $68,931 | $28,000 | $40,931 |
| 2021 | $1,077 | $61,229 | $27,300 | $33,929 |
| 2020 | $997 | $59,571 | $24,150 | $35,421 |
| 2019 | $935 | $56,936 | $21,700 | $35,236 |
| 2018 | $892 | $46,592 | $12,600 | $33,992 |
| 2017 | $1,304 | $44,981 | $10,850 | $34,131 |
| 2016 | $836 | $44,330 | $9,450 | $34,880 |
| 2015 | $833 | $41,359 | $7,000 | $34,359 |
| 2014 | $807 | $27,034 | $5,600 | $21,434 |
Source: Public Records
Map
Nearby Homes
- 124 Tapatio St
- 126 Montclair Dr
- 107 Tapatio St Unit 83
- 2458 Tour Edition Dr
- 167 Wynntry Cir
- 112 Wynntry Dr
- 2713 Knightsbridge Rd
- 2719 Lovington Dr
- 2716 Knightsbridge Rd
- 2720 Knightsbridge Rd
- 2496 Ram Crossing Way
- 2685 Mallard Landing Ave
- 2723 Mallard Landing Ave Unit 4
- 37 Bishopsgate Terrace
- 2704 Coventry Green Ave
- 2505 Cortina Ave
- 2707 Fan Palm Ct
- 207 Charter Oak St
- 2850 Nikki Place
- 2544 Kinnard Ave
- 131 Tapatio St Unit 93
- 127 Tapatio St
- 133 Tapatio St Unit 94
- 138 Painted Valley St
- 108 Tapatio St
- 121 Tapatio St Unit 88
- 129 Tapatio St
- 142 Tapatio St
- 115 Tapatio St
- 119 Tapatio St
- 110 Tapatio St Unit 74
- 119 Tapatio St Unit 87
- 106 Painted Valley St
- 113 Tapatio St Unit n/a
- 113 Tapatio St Unit 84
- 123 Tapatio St Unit 89
- 117 Tapatio St Unit 86
- 125 Tapatio St Unit 90
- 120 Painted Valley St
- 122 Painted Valley St Unit 108