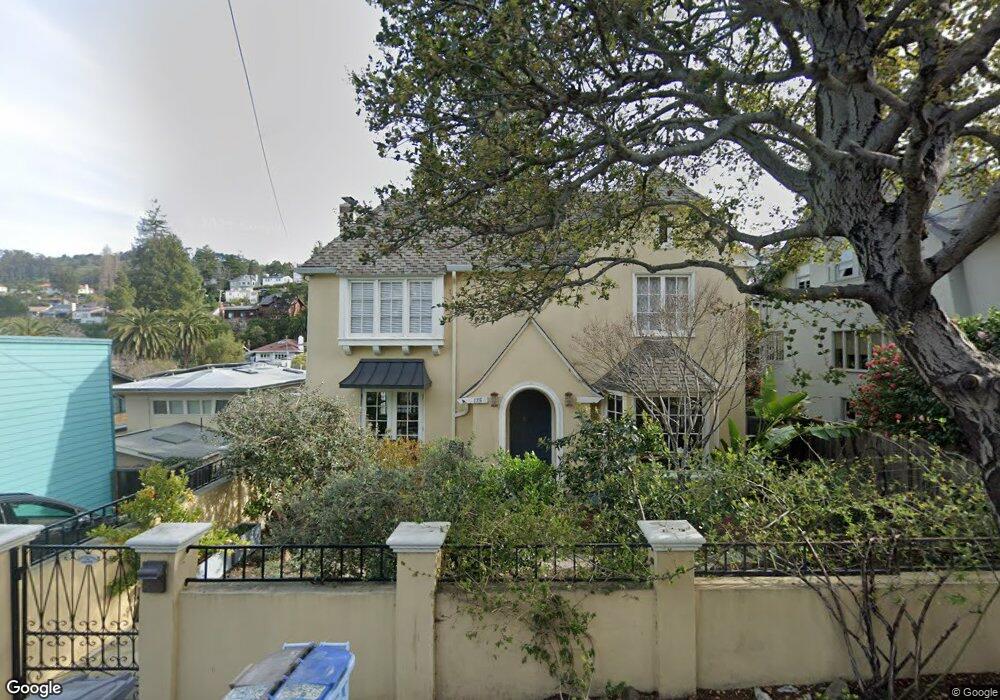
135 The Uplands Berkeley, CA 94705
Claremont NeighborhoodEstimated Value: $2,574,441 - $3,494,000
4
Beds
2
Baths
3,048
Sq Ft
$981/Sq Ft
Est. Value
About This Home
This home is located at 135 The Uplands, Berkeley, CA 94705 and is currently estimated at $2,991,610, approximately $981 per square foot. 135 The Uplands is a home located in Alameda County with nearby schools including John Muir Elementary School, Emerson Elementary School, and Malcolm X Elementary School.
Ownership History
Date
Name
Owned For
Owner Type
Purchase Details
Closed on
Nov 5, 2021
Sold by
Policy James F and Policy Kristen
Bought by
Policy James F and Policy Kristen A
Current Estimated Value
Purchase Details
Closed on
Jan 12, 2007
Sold by
Davis Janice Harris and Harris Janice
Bought by
Policy James F and Policy Kristen
Home Financials for this Owner
Home Financials are based on the most recent Mortgage that was taken out on this home.
Original Mortgage
$975,000
Outstanding Balance
$575,821
Interest Rate
6%
Mortgage Type
Purchase Money Mortgage
Estimated Equity
$2,415,789
Purchase Details
Closed on
Jun 10, 2005
Sold by
Harris Janice and Thomas West Harris Iii Living
Bought by
Harris Janice and Davis Janice
Purchase Details
Closed on
Nov 3, 1993
Sold by
Harris Thomas West
Bought by
The Thomas West Harris 1993 Living Trust
Create a Home Valuation Report for This Property
The Home Valuation Report is an in-depth analysis detailing your home's value as well as a comparison with similar homes in the area
Home Values in the Area
Average Home Value in this Area
Purchase History
| Date | Buyer | Sale Price | Title Company |
|---|---|---|---|
| Policy James F | -- | None Available | |
| Policy James F | $1,275,000 | Placer Title Company | |
| Harris Janice | -- | Alliance Title | |
| The Thomas West Harris 1993 Living Trust | -- | -- |
Source: Public Records
Mortgage History
| Date | Status | Borrower | Loan Amount |
|---|---|---|---|
| Open | Policy James F | $975,000 |
Source: Public Records
Tax History
| Year | Tax Paid | Tax Assessment Tax Assessment Total Assessment is a certain percentage of the fair market value that is determined by local assessors to be the total taxable value of land and additions on the property. | Land | Improvement |
|---|---|---|---|---|
| 2025 | $26,438 | $1,717,612 | $512,427 | $1,212,185 |
| 2024 | $26,438 | $1,683,807 | $502,383 | $1,188,424 |
| 2023 | $25,889 | $1,657,658 | $492,533 | $1,165,125 |
| 2022 | $25,419 | $1,618,166 | $482,879 | $1,142,287 |
| 2021 | $25,482 | $1,586,304 | $473,412 | $1,119,892 |
| 2020 | $24,067 | $1,576,968 | $468,558 | $1,108,410 |
| 2019 | $23,078 | $1,546,059 | $459,374 | $1,086,685 |
| 2018 | $22,688 | $1,515,755 | $450,370 | $1,065,385 |
| 2017 | $21,929 | $1,486,044 | $441,542 | $1,044,502 |
| 2016 | $21,212 | $1,456,911 | $432,886 | $1,024,025 |
| 2015 | $20,926 | $1,435,040 | $426,388 | $1,008,652 |
| 2014 | $20,721 | $1,406,938 | $418,038 | $988,900 |
Source: Public Records
Map
Nearby Homes
- 204 El Camino Real
- 1488 Alvarado Rd
- 0 Tunnel Rd
- 45 Vicente Rd
- 641 Alvarado Rd
- 6189 Margarido Dr
- 5668 Buena Vista Ave
- 260 Alvarado Rd
- 5936 Broadway
- 150 Vicente Rd
- 0 Gravatt Dr Unit 41122154
- 2962 Piedmont Ave
- 2 Gravatt Dr
- 5941 Keith Ave
- 142 Gravatt Dr
- 5416 Golden Gate Ave
- 190 Stonewall Rd
- 6100 Chabot Rd
- 287 Cross Rd
- 1426 Grand View Dr
- 147 The Uplands
- 136 Parkside Dr
- 155 Parkside Dr
- 134 Parkside Dr
- 151 The Uplands
- 175 The Uplands
- 185 The Uplands
- 130 Parkside Dr
- 138 The Uplands
- 153 Parkside Dr
- 140 The Uplands
- 134 The Uplands
- 195 The Uplands
- 128 Parkside Dr
- 130 The Uplands
- 199 The Uplands
- 149 Parkside Dr
- 233 Hillcrest Rd
- 124 Parkside Dr
- 160 The Uplands
Your Personal Tour Guide
Ask me questions while you tour the home.