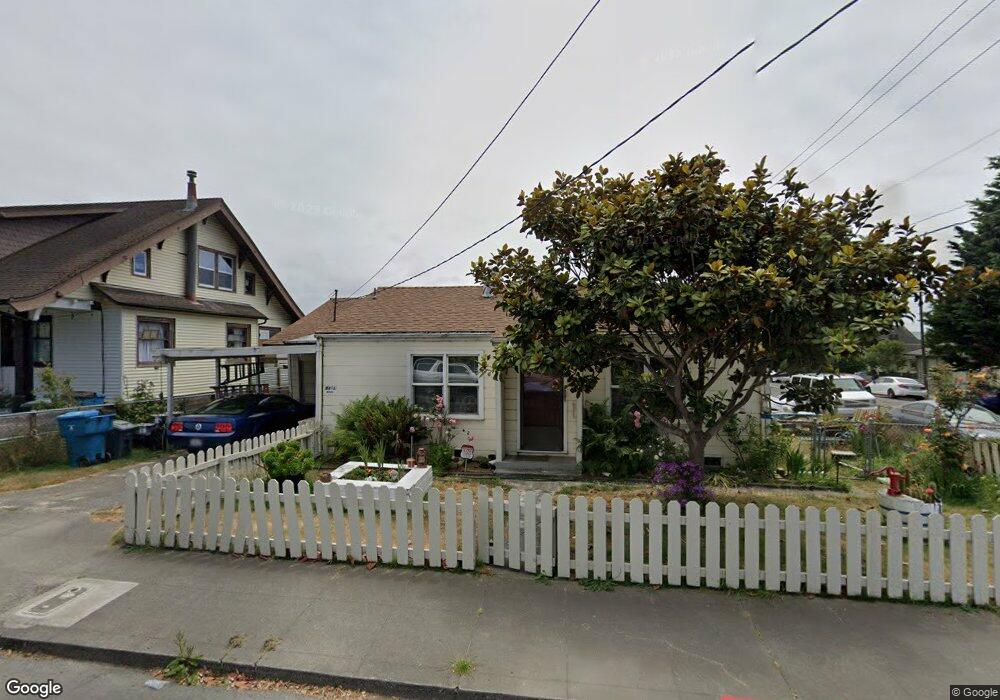
135 W 14th St Eureka, CA 95501
Broadway Street NeighborhoodEstimated Value: $309,000 - $375,000
2
Beds
1
Bath
1,183
Sq Ft
$279/Sq Ft
Est. Value
About This Home
This home is located at 135 W 14th St, Eureka, CA 95501 and is currently estimated at $329,783, approximately $278 per square foot. 135 W 14th St is a home located in Humboldt County with nearby schools including Lafayette Elementary School, Catherine L. Zane Middle School, and Eureka Senior High School.
Ownership History
Date
Name
Owned For
Owner Type
Purchase Details
Closed on
Feb 21, 2007
Sold by
Frost John R and Estate Of Leola Ella Ratila
Bought by
Lane James H
Current Estimated Value
Home Financials for this Owner
Home Financials are based on the most recent Mortgage that was taken out on this home.
Original Mortgage
$120,000
Outstanding Balance
$72,393
Interest Rate
6.29%
Mortgage Type
Stand Alone Second
Estimated Equity
$257,390
Create a Home Valuation Report for This Property
The Home Valuation Report is an in-depth analysis detailing your home's value as well as a comparison with similar homes in the area
Home Values in the Area
Average Home Value in this Area
Purchase History
| Date | Buyer | Sale Price | Title Company |
|---|---|---|---|
| Lane James H | $180,000 | Fidelity Natl Title Co Of Ca | |
| Lane James H | -- | Fidelity Natl Title Co Of Ca |
Source: Public Records
Mortgage History
| Date | Status | Borrower | Loan Amount |
|---|---|---|---|
| Open | Lane James H | $120,000 | |
| Closed | Lane James H | $62,500 |
Source: Public Records
Tax History
| Year | Tax Paid | Tax Assessment Tax Assessment Total Assessment is a certain percentage of the fair market value that is determined by local assessors to be the total taxable value of land and additions on the property. | Land | Improvement |
|---|---|---|---|---|
| 2025 | $2,407 | $241,146 | $154,069 | $87,077 |
| 2024 | $2,407 | $236,419 | $151,049 | $85,370 |
| 2023 | $2,371 | $231,785 | $148,088 | $83,697 |
| 2022 | $2,460 | $227,241 | $145,185 | $82,056 |
| 2021 | $1,654 | $162,000 | $90,000 | $72,000 |
| 2020 | $1,659 | $162,000 | $90,000 | $72,000 |
| 2019 | $1,657 | $162,000 | $90,000 | $72,000 |
| 2018 | $1,665 | $162,000 | $90,000 | $72,000 |
| 2017 | $1,689 | $162,000 | $90,000 | $72,000 |
| 2016 | $1,635 | $154,000 | $100,000 | $54,000 |
| 2015 | $1,645 | $154,000 | $100,000 | $54,000 |
| 2014 | $1,568 | $154,000 | $100,000 | $54,000 |
Source: Public Records
Map
Nearby Homes
Your Personal Tour Guide
Ask me questions while you tour the home.