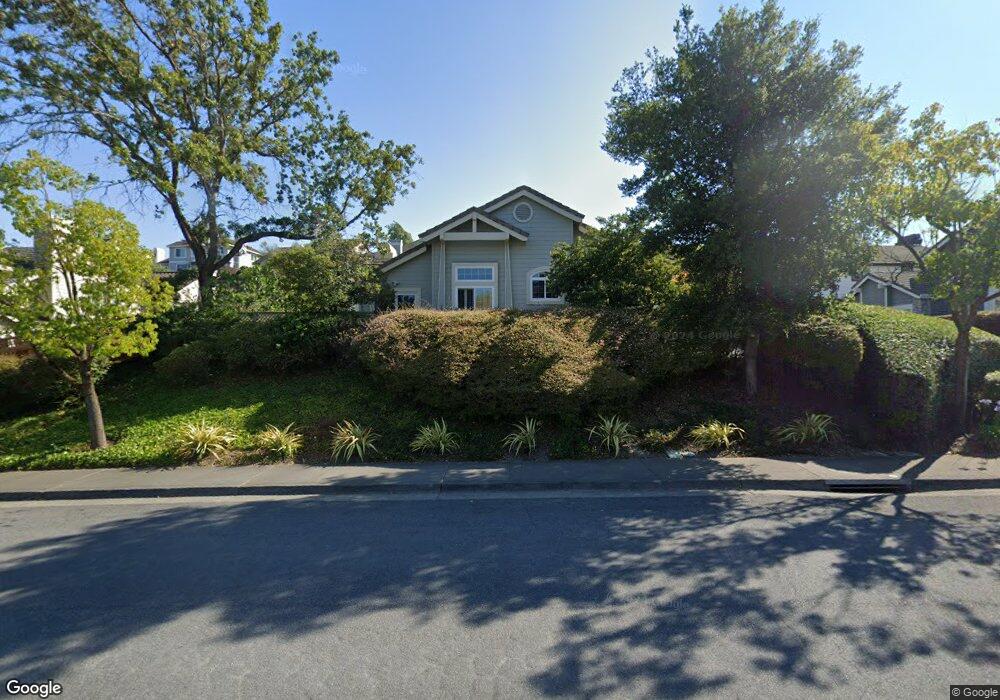
135 Windsor Dr Petaluma, CA 94952
Western Petaluma NeighborhoodEstimated Value: $883,000 - $1,075,000
3
Beds
2
Baths
1,499
Sq Ft
$626/Sq Ft
Est. Value
About This Home
This home is located at 135 Windsor Dr, Petaluma, CA 94952 and is currently estimated at $938,419, approximately $626 per square foot. 135 Windsor Dr is a home located in Sonoma County with nearby schools including McNear Elementary School, Petaluma Junior High School, and Petaluma High School.
Ownership History
Date
Name
Owned For
Owner Type
Purchase Details
Closed on
Oct 6, 2016
Sold by
Essig Scott Wardner
Bought by
Essig Scott and Essig Tiffany
Current Estimated Value
Purchase Details
Closed on
Nov 1, 2013
Sold by
Essig Raul Camarigg W and Essig Robert W
Bought by
Essig Raul Camarigg and Essig Scott Wardner
Purchase Details
Closed on
Oct 20, 2000
Sold by
Leonides Eduardo N
Bought by
Reyes Lidio A and Romero Bernardina
Purchase Details
Closed on
Sep 19, 2000
Sold by
Essig Robert W and Essig Sylvia V
Bought by
Essig Robert W and Essig Sylvia V
Purchase Details
Closed on
Aug 13, 1991
Bought by
Essig Raul Camariff
Create a Home Valuation Report for This Property
The Home Valuation Report is an in-depth analysis detailing your home's value as well as a comparison with similar homes in the area
Home Values in the Area
Average Home Value in this Area
Purchase History
| Date | Buyer | Sale Price | Title Company |
|---|---|---|---|
| Essig Scott | -- | None Available | |
| Essig Raul Camarigg | -- | None Available | |
| Reyes Lidio A | -- | -- | |
| Essig Robert W | -- | -- | |
| Essig Raul Camariff | $265,000 | -- |
Source: Public Records
Tax History Compared to Growth
Tax History
| Year | Tax Paid | Tax Assessment Tax Assessment Total Assessment is a certain percentage of the fair market value that is determined by local assessors to be the total taxable value of land and additions on the property. | Land | Improvement |
|---|---|---|---|---|
| 2025 | $5,158 | $468,582 | $212,185 | $256,397 |
| 2024 | $5,158 | $459,395 | $208,025 | $251,370 |
| 2023 | $5,158 | $450,389 | $203,947 | $246,442 |
| 2022 | $4,969 | $441,559 | $199,949 | $241,610 |
| 2021 | $4,876 | $432,902 | $196,029 | $236,873 |
| 2020 | $4,918 | $428,464 | $194,019 | $234,445 |
| 2019 | $4,858 | $420,064 | $190,215 | $229,849 |
| 2018 | $4,840 | $411,829 | $186,486 | $225,343 |
| 2017 | $4,740 | $403,755 | $182,830 | $220,925 |
| 2016 | $4,626 | $395,840 | $179,246 | $216,594 |
| 2015 | $4,562 | $389,895 | $176,554 | $213,341 |
| 2014 | $4,541 | $382,258 | $173,096 | $209,162 |
Source: Public Records
Map
Nearby Homes