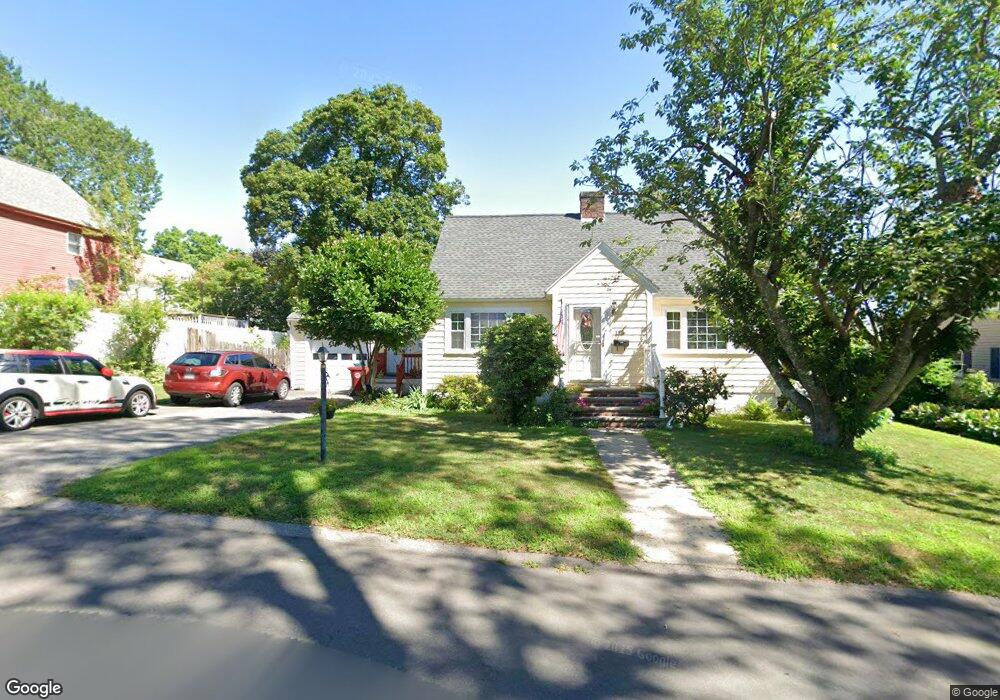
135 Winthrop Ave Lowell, MA 01851
Lower Highlands NeighborhoodEstimated Value: $535,311 - $550,000
3
Beds
1
Bath
1,462
Sq Ft
$372/Sq Ft
Est. Value
About This Home
This home is located at 135 Winthrop Ave, Lowell, MA 01851 and is currently estimated at $543,578, approximately $371 per square foot. 135 Winthrop Ave is a home located in Middlesex County with nearby schools including Charles W. Morey Elementary School, Abraham Lincoln Elementary School, and Dr. Gertrude Bailey Elementary School.
Ownership History
Date
Name
Owned For
Owner Type
Purchase Details
Closed on
Nov 26, 2002
Sold by
Smith Kadeen T
Bought by
Fineberg Bunkhoeu
Current Estimated Value
Home Financials for this Owner
Home Financials are based on the most recent Mortgage that was taken out on this home.
Original Mortgage
$148,550
Outstanding Balance
$63,028
Interest Rate
6.07%
Mortgage Type
Purchase Money Mortgage
Estimated Equity
$480,550
Create a Home Valuation Report for This Property
The Home Valuation Report is an in-depth analysis detailing your home's value as well as a comparison with similar homes in the area
Home Values in the Area
Average Home Value in this Area
Purchase History
| Date | Buyer | Sale Price | Title Company |
|---|---|---|---|
| Fineberg Bunkhoeu | $209,000 | -- | |
| Fineberg Bunkhoeu | $209,000 | -- |
Source: Public Records
Mortgage History
| Date | Status | Borrower | Loan Amount |
|---|---|---|---|
| Open | Fineberg Bunkhoeu | $148,550 | |
| Closed | Fineberg Bunkhoeu | $148,550 | |
| Previous Owner | Fineberg Bunkhoeu | $140,000 |
Source: Public Records
Tax History
| Year | Tax Paid | Tax Assessment Tax Assessment Total Assessment is a certain percentage of the fair market value that is determined by local assessors to be the total taxable value of land and additions on the property. | Land | Improvement |
|---|---|---|---|---|
| 2025 | $5,770 | $502,600 | $213,400 | $289,200 |
| 2024 | $5,491 | $461,000 | $199,400 | $261,600 |
| 2023 | $5,337 | $429,700 | $173,400 | $256,300 |
| 2022 | $4,873 | $384,000 | $157,700 | $226,300 |
| 2021 | $4,572 | $339,700 | $137,100 | $202,600 |
| 2020 | $4,317 | $323,100 | $123,100 | $200,000 |
| 2019 | $4,237 | $301,800 | $122,000 | $179,800 |
| 2018 | $4,088 | $284,100 | $116,200 | $167,900 |
| 2017 | $4,133 | $277,000 | $112,600 | $164,400 |
| 2016 | $3,804 | $250,900 | $101,500 | $149,400 |
| 2015 | $3,742 | $241,700 | $101,500 | $140,200 |
| 2013 | $3,577 | $238,300 | $115,700 | $122,600 |
Source: Public Records
Map
Nearby Homes
- 85 B St
- 186 Powell St
- 108 Inland St
- 710 School St
- 18 Burgess St
- 525 Chelmsford St
- 11 Warwick St Unit 3
- 137 Pine St Unit 11
- 37 Saint Paul St
- 15 Barclay St
- 142 Sanders Ave
- 17 Edson St
- 138 W Forest St
- 68 Smith St
- 3 Butman Place
- 312 Wilder St
- 84 Cambridge St
- 173 Princeton Blvd
- 255 Plain St
- 694 Westford St
Your Personal Tour Guide
Ask me questions while you tour the home.