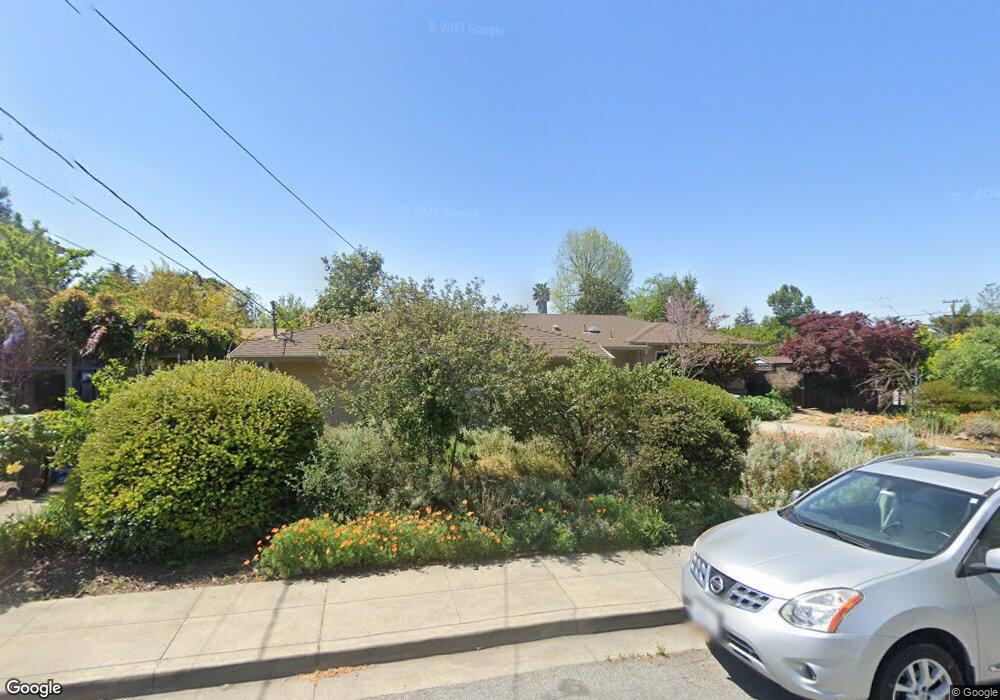
1350 Austin St Fremont, CA 94539
Mission Valley NeighborhoodEstimated Value: $1,860,000 - $2,536,000
3
Beds
2
Baths
1,517
Sq Ft
$1,488/Sq Ft
Est. Value
About This Home
This home is located at 1350 Austin St, Fremont, CA 94539 and is currently estimated at $2,257,568, approximately $1,488 per square foot. 1350 Austin St is a home located in Alameda County with nearby schools including Joshua Chadbourne Elementary School, William Hopkins Junior High School, and Mission San Jose High School.
Ownership History
Date
Name
Owned For
Owner Type
Purchase Details
Closed on
Mar 19, 2019
Sold by
Gustafson John and Gustafson Michino
Bought by
Malla Kameswararao and Gudla Swati
Current Estimated Value
Home Financials for this Owner
Home Financials are based on the most recent Mortgage that was taken out on this home.
Original Mortgage
$200,000
Outstanding Balance
$170,482
Interest Rate
3%
Mortgage Type
Adjustable Rate Mortgage/ARM
Estimated Equity
$2,087,086
Purchase Details
Closed on
Dec 29, 2009
Sold by
Gustafson John and Gustafson Michino
Bought by
Gustafson John and Gustafson Michino
Purchase Details
Closed on
Jun 27, 1996
Sold by
Maxoutopoulis Jeffery J and Maxoutopoulis Theresia G
Bought by
Gustafson John and Gustafson Michino
Home Financials for this Owner
Home Financials are based on the most recent Mortgage that was taken out on this home.
Original Mortgage
$272,700
Interest Rate
8.01%
Create a Home Valuation Report for This Property
The Home Valuation Report is an in-depth analysis detailing your home's value as well as a comparison with similar homes in the area
Home Values in the Area
Average Home Value in this Area
Purchase History
| Date | Buyer | Sale Price | Title Company |
|---|---|---|---|
| Malla Kameswararao | $1,500,000 | Chicago Title Company | |
| Gustafson John | -- | None Available | |
| Gustafson John | $303,000 | Placer Title Company |
Source: Public Records
Mortgage History
| Date | Status | Borrower | Loan Amount |
|---|---|---|---|
| Open | Malla Kameswararao | $200,000 | |
| Previous Owner | Gustafson John | $272,700 |
Source: Public Records
Tax History Compared to Growth
Tax History
| Year | Tax Paid | Tax Assessment Tax Assessment Total Assessment is a certain percentage of the fair market value that is determined by local assessors to be the total taxable value of land and additions on the property. | Land | Improvement |
|---|---|---|---|---|
| 2025 | $19,329 | $1,666,250 | $613,525 | $1,059,725 |
| 2024 | $19,329 | $1,633,444 | $601,496 | $1,038,948 |
| 2023 | $18,833 | $1,608,284 | $589,704 | $1,018,580 |
| 2022 | $18,621 | $1,569,754 | $578,143 | $998,611 |
| 2021 | $18,155 | $1,538,840 | $566,808 | $979,032 |
| 2020 | $18,310 | $1,530,000 | $561,000 | $969,000 |
| 2019 | $5,772 | $446,641 | $132,711 | $313,930 |
| 2018 | $5,656 | $437,885 | $130,109 | $307,776 |
| 2017 | $5,515 | $429,302 | $127,559 | $301,743 |
| 2016 | $5,413 | $420,885 | $125,058 | $295,827 |
| 2015 | $5,334 | $414,565 | $123,180 | $291,385 |
| 2014 | $5,237 | $406,445 | $120,767 | $285,678 |
Source: Public Records
Map
Nearby Homes
- 1123 Farragut Dr
- 1962 Briscoe Terrace
- 41082 Joyce Ave
- 41519 Apricot Ln
- 41043 Joyce Ave
- 1224 Bedford St
- 1401 Lemos Ln
- 260 Jacaranda Dr
- 40743 Rainwater Ct Unit 80
- 2225 Valorie St
- 41620 Beatrice St
- 2851 Finca Terrace
- 41538 Casabella Common
- 41246 Mission Blvd
- 2785 Washington Blvd
- 42329 Troyer Ave
- 40613 Encanto Way
- 41252 Mission Blvd
- 3331 Union St
- 40425 Chapel Way Unit 214
- 1444 Kensington Dr
- 1336 Austin St
- 1345 Austin St
- 1462 Kensington Dr
- 1493 Harrington St
- 1433 Kensington Dr
- 1331 Austin St
- 1377 Kensington Dr
- 1322 Austin St
- 1451 Kensington Dr
- 1487 Harrington St
- 1341 Kensington Dr
- 1317 Austin St
- 1469 Kensington Dr
- 1250 Kensington Dr
- 1469 Harrington St
- 1323 Kensington Dr
- 1308 Austin St
- 1263 Farragut Dr
- 1451 Harrington St