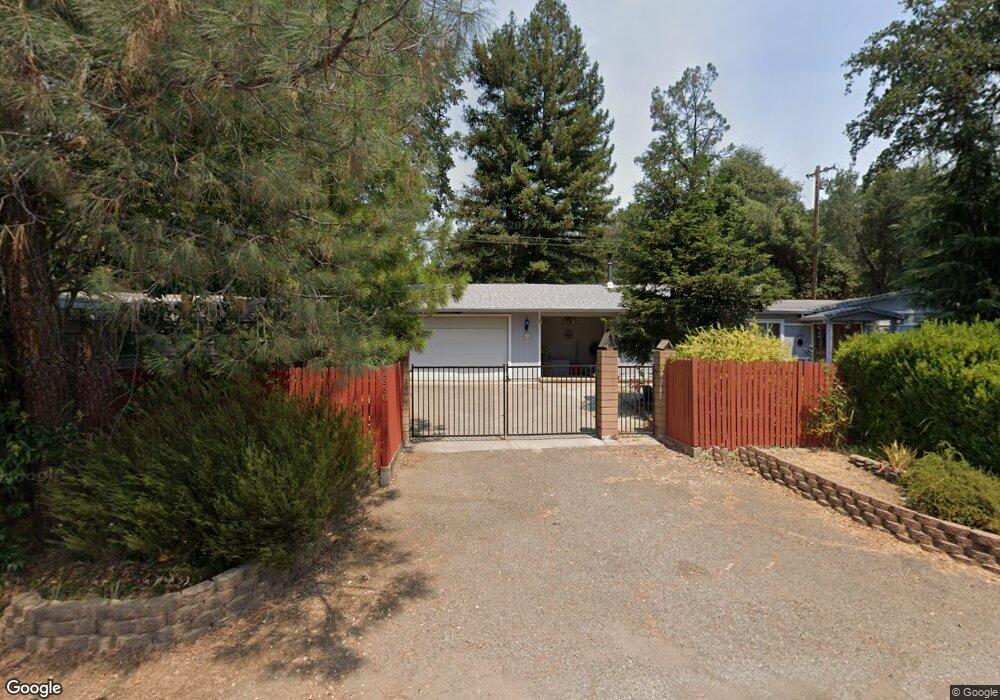
1350 Branstetter Ln Redding, CA 96001
Branstetter NeighborhoodEstimated Value: $132,000 - $208,000
2
Beds
1
Bath
928
Sq Ft
$198/Sq Ft
Est. Value
About This Home
This home is located at 1350 Branstetter Ln, Redding, CA 96001 and is currently estimated at $183,760, approximately $198 per square foot. 1350 Branstetter Ln is a home located in Shasta County with nearby schools including Sycamore Elementary School, Sequoia Middle School, and Shasta High School.
Ownership History
Date
Name
Owned For
Owner Type
Purchase Details
Closed on
May 5, 2005
Sold by
Wright Gary Ward
Bought by
Roy Iris P
Current Estimated Value
Home Financials for this Owner
Home Financials are based on the most recent Mortgage that was taken out on this home.
Original Mortgage
$157,000
Outstanding Balance
$80,701
Interest Rate
5.62%
Mortgage Type
Stand Alone Refi Refinance Of Original Loan
Estimated Equity
$103,059
Purchase Details
Closed on
Aug 11, 1997
Sold by
Hud
Bought by
Roy Iris P
Home Financials for this Owner
Home Financials are based on the most recent Mortgage that was taken out on this home.
Original Mortgage
$45,782
Interest Rate
7.61%
Mortgage Type
FHA
Purchase Details
Closed on
Feb 10, 1997
Sold by
Norwest Mtg Inc
Bought by
Hud
Purchase Details
Closed on
Dec 27, 1996
Sold by
Meeker Wesley E
Bought by
Norwest Mtg Inc
Create a Home Valuation Report for This Property
The Home Valuation Report is an in-depth analysis detailing your home's value as well as a comparison with similar homes in the area
Home Values in the Area
Average Home Value in this Area
Purchase History
| Date | Buyer | Sale Price | Title Company |
|---|---|---|---|
| Roy Iris P | -- | -- | |
| Roy Iris P | $45,500 | Fidelity National Title | |
| Hud | -- | Fidelity National Title Ins | |
| Norwest Mtg Inc | $80,562 | Fidelity National Title |
Source: Public Records
Mortgage History
| Date | Status | Borrower | Loan Amount |
|---|---|---|---|
| Open | Roy Iris P | $157,000 | |
| Closed | Roy Iris P | $45,782 |
Source: Public Records
Tax History Compared to Growth
Tax History
| Year | Tax Paid | Tax Assessment Tax Assessment Total Assessment is a certain percentage of the fair market value that is determined by local assessors to be the total taxable value of land and additions on the property. | Land | Improvement |
|---|---|---|---|---|
| 2025 | $711 | $72,621 | $25,532 | $47,089 |
| 2024 | $698 | $71,198 | $25,032 | $46,166 |
| 2023 | $698 | $69,803 | $24,542 | $45,261 |
| 2022 | $684 | $68,435 | $24,061 | $44,374 |
| 2021 | $678 | $67,094 | $23,590 | $43,504 |
| 2020 | $686 | $66,407 | $23,349 | $43,058 |
| 2019 | $650 | $65,106 | $22,892 | $42,214 |
| 2018 | $654 | $63,831 | $22,444 | $41,387 |
| 2017 | $648 | $62,580 | $22,004 | $40,576 |
| 2016 | $627 | $61,354 | $21,573 | $39,781 |
| 2015 | $618 | $60,433 | $21,249 | $39,184 |
| 2014 | $612 | $59,250 | $20,833 | $38,417 |
Source: Public Records
Map
Nearby Homes
- 762 Branstetter Ln
- 5750 Cedars Rd
- 5812 Cedars Rd Unit 36
- 5812 Cedars Rd Unit 3
- 4750 Enchanted Way
- 2200 Jewell Ln
- 441 Branstetter Ln
- 2006 Wilder Dr
- 2794 Summerbreeze Place
- 2048 Wilder Dr
- 4410 Melody Ln
- 2779 Summerbreeze Place
- 2079 Wilder Dr
- 6494 Leonard Dr
- 2396 Wilsey Dr
- 2440 Howard Dr
- 2339 North Dr
- 6405 El Camino Dr
- 2680 Howard Dr
- 2535 Ruby Ct
- 1360 Branstetter Ln
- 1370 Branstetter Ln
- 1360 1370 Branstetter
- 1380 Branstetter Ln
- 1310 Branstetter Ln
- 1390 Branstetter 1weup7n136y3
- 1337 Branstetter Ln
- 1335 Branstetter Ln
- 1361 Branstetter Ln
- 1300 Branstetter Ln
- 1391 Branstetter Ln
- 1321 Branstetter Ln
- 1301 Branstetter Ln
- 1550 Branstetter Ln
- 1420 Branstetter Ln
- 1450 Branstetter Ln
- 1562 Branstetter Ln
- 1590 Branstetter Ln
- 1530 Branstetter Cir
- 1540 Branstetter Cir