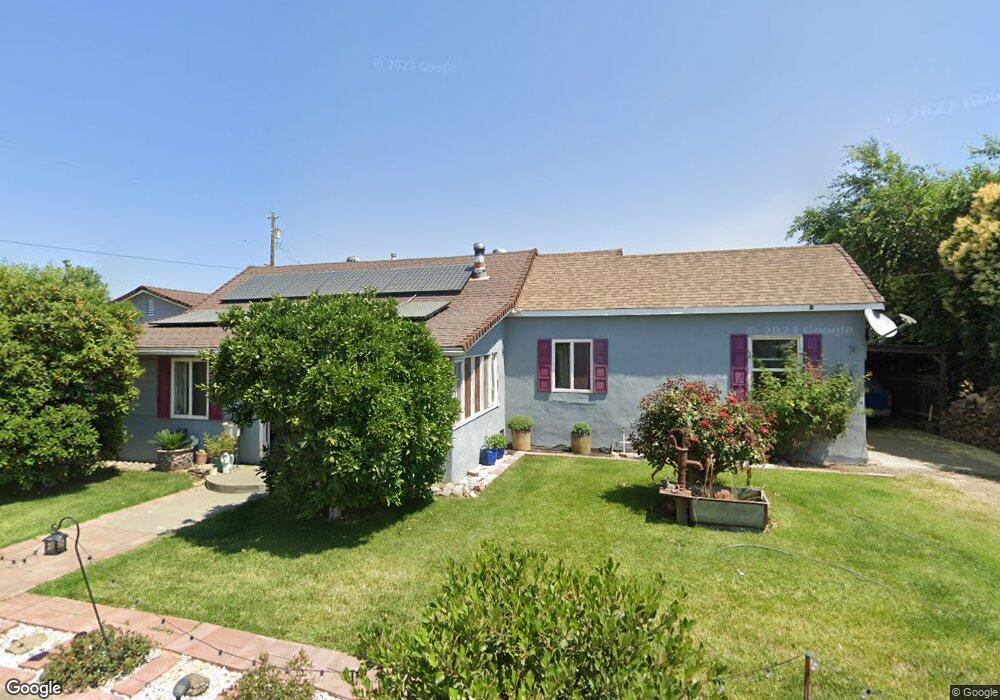
1350 Clay St Colusa, CA 95932
Estimated Value: $390,000 - $632,000
3
Beds
2
Baths
1,820
Sq Ft
$264/Sq Ft
Est. Value
About This Home
This home is located at 1350 Clay St, Colusa, CA 95932 and is currently estimated at $479,637, approximately $263 per square foot. 1350 Clay St is a home located in Colusa County with nearby schools including James M. Burchfield Primary School, George T. Egling Middle School, and Colusa High School.
Ownership History
Date
Name
Owned For
Owner Type
Purchase Details
Closed on
Apr 24, 2020
Sold by
Sanchez Javier and Sanchez Silvia G
Bought by
Sanchez Silvia G and Sanchez Javier
Current Estimated Value
Home Financials for this Owner
Home Financials are based on the most recent Mortgage that was taken out on this home.
Original Mortgage
$225,000
Outstanding Balance
$156,173
Interest Rate
3.6%
Mortgage Type
New Conventional
Estimated Equity
$323,464
Purchase Details
Closed on
May 13, 2005
Sold by
Canchola Properties Llc
Bought by
Sanchez Javier and Sanchez Silvia G
Home Financials for this Owner
Home Financials are based on the most recent Mortgage that was taken out on this home.
Original Mortgage
$250,000
Interest Rate
6.37%
Mortgage Type
Fannie Mae Freddie Mac
Purchase Details
Closed on
Oct 25, 2004
Sold by
Mcgee Wayne Robin and The Wayne Robin Mcgee Living T
Bought by
Conchola Properties Llc
Create a Home Valuation Report for This Property
The Home Valuation Report is an in-depth analysis detailing your home's value as well as a comparison with similar homes in the area
Home Values in the Area
Average Home Value in this Area
Purchase History
| Date | Buyer | Sale Price | Title Company |
|---|---|---|---|
| Sanchez Silvia G | -- | First American Title Company | |
| Sanchez Javier | $250,500 | Fidelity Natl Title Co Of Ca | |
| Conchola Properties Llc | -- | Western Title Colusa County |
Source: Public Records
Mortgage History
| Date | Status | Borrower | Loan Amount |
|---|---|---|---|
| Open | Sanchez Silvia G | $225,000 | |
| Closed | Sanchez Javier | $250,000 |
Source: Public Records
Tax History
| Year | Tax Paid | Tax Assessment Tax Assessment Total Assessment is a certain percentage of the fair market value that is determined by local assessors to be the total taxable value of land and additions on the property. | Land | Improvement |
|---|---|---|---|---|
| 2025 | $3,730 | $348,461 | $125,443 | $223,018 |
| 2024 | $3,730 | $341,630 | $122,984 | $218,646 |
| 2023 | $3,578 | $334,932 | $120,573 | $214,359 |
| 2022 | $3,577 | $328,365 | $118,209 | $210,156 |
| 2021 | $2,880 | $269,000 | $45,000 | $224,000 |
| 2020 | $2,596 | $242,000 | $40,000 | $202,000 |
| 2019 | $2,584 | $242,000 | $40,000 | $202,000 |
| 2018 | $2,376 | $218,000 | $40,000 | $178,000 |
| 2017 | $2,181 | $198,000 | $40,000 | $158,000 |
| 2016 | $1,784 | $160,000 | $30,000 | $130,000 |
| 2015 | $1,765 | $160,000 | $30,000 | $130,000 |
| 2014 | $1,507 | $140,000 | $30,000 | $110,000 |
Source: Public Records
Map
Nearby Homes
- 1771 Lurline Ave
- 738 Webster St
- 724 Webster St
- 745 Main St
- 243 7th St
- 528 Clay St
- 731 Sioc St
- 0 Ware Ave
- 1003 4th St
- 0 E Carson St Unit 225122408
- 7300 Farinon Rd
- 1425 5th St
- 130 Fremont St
- 121 Lafayette St
- 35 Parkhill St
- 251 Allen Cir
- 351 Sequoia Way
- 3869 River Rd
- 139 Country Club Dr
- 23 Walnut Tree Dr
Your Personal Tour Guide
Ask me questions while you tour the home.