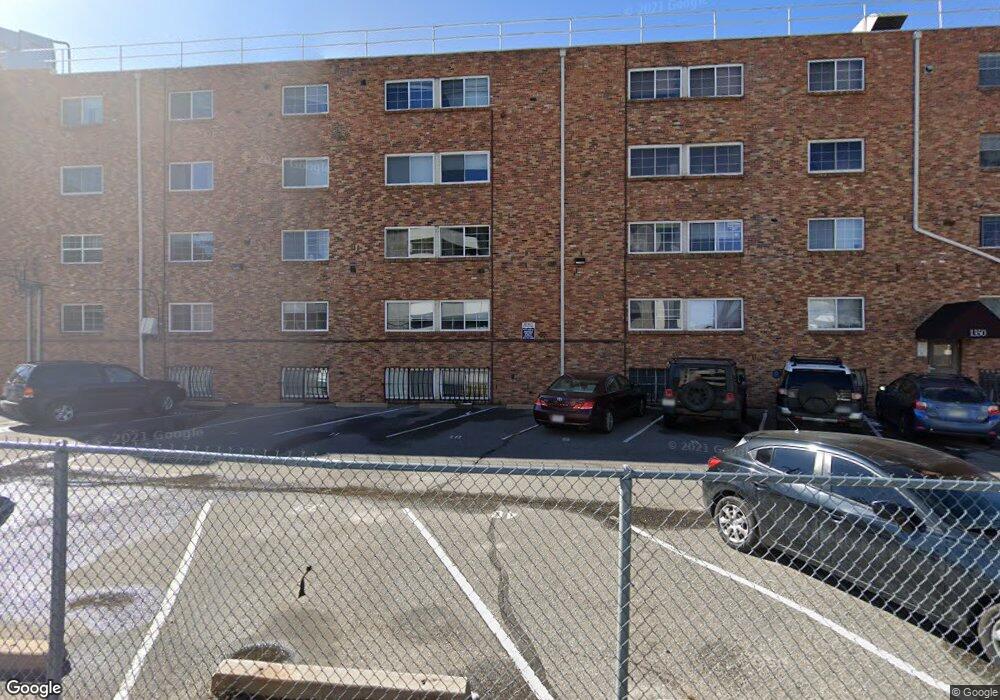
Dublin Terrace 1350 Josephine St Denver, CO 80206
Congress Park NeighborhoodEstimated Value: $311,000 - $347,000
2
Beds
1
Bath
897
Sq Ft
$368/Sq Ft
Est. Value
About This Home
This home is located at 1350 Josephine St, Denver, CO 80206 and is currently estimated at $330,231, approximately $368 per square foot. 1350 Josephine St is a home located in Denver County with nearby schools including Teller Elementary School, Morey Middle School, and East High School.
Ownership History
Date
Name
Owned For
Owner Type
Purchase Details
Closed on
Jun 15, 2018
Sold by
Friedman Lana Rae
Bought by
Head Brian
Current Estimated Value
Home Financials for this Owner
Home Financials are based on the most recent Mortgage that was taken out on this home.
Original Mortgage
$309,784
Outstanding Balance
$267,123
Interest Rate
4.37%
Mortgage Type
FHA
Estimated Equity
$63,108
Purchase Details
Closed on
Jun 28, 2013
Sold by
Lta Investments Llc
Bought by
Friedman Lana Rae
Purchase Details
Closed on
Sep 24, 1999
Sold by
Robinson Investment Corp
Bought by
Friedman Lana R
Home Financials for this Owner
Home Financials are based on the most recent Mortgage that was taken out on this home.
Original Mortgage
$51,000
Interest Rate
8.18%
Create a Home Valuation Report for This Property
The Home Valuation Report is an in-depth analysis detailing your home's value as well as a comparison with similar homes in the area
Home Values in the Area
Average Home Value in this Area
Purchase History
| Date | Buyer | Sale Price | Title Company |
|---|---|---|---|
| Head Brian | $315,500 | Land Title Guarantee | |
| Friedman Lana Rae | -- | None Available | |
| Friedman Lana R | $132,292 | -- |
Source: Public Records
Mortgage History
| Date | Status | Borrower | Loan Amount |
|---|---|---|---|
| Open | Head Brian | $309,784 | |
| Previous Owner | Friedman Lana R | $51,000 |
Source: Public Records
Tax History Compared to Growth
Tax History
| Year | Tax Paid | Tax Assessment Tax Assessment Total Assessment is a certain percentage of the fair market value that is determined by local assessors to be the total taxable value of land and additions on the property. | Land | Improvement |
|---|---|---|---|---|
| 2024 | $1,773 | $22,380 | $2,740 | $19,640 |
| 2023 | $1,734 | $22,380 | $2,740 | $19,640 |
| 2022 | $1,945 | $24,460 | $2,840 | $21,620 |
| 2021 | $1,945 | $25,160 | $2,920 | $22,240 |
| 2020 | $1,760 | $23,720 | $2,560 | $21,160 |
| 2019 | $1,711 | $23,720 | $2,560 | $21,160 |
| 2018 | $1,160 | $15,000 | $2,390 | $12,610 |
| 2017 | $1,157 | $15,000 | $2,390 | $12,610 |
| 2016 | $914 | $11,210 | $2,038 | $9,172 |
| 2015 | $876 | $11,210 | $2,038 | $9,172 |
| 2014 | $794 | $9,560 | $1,504 | $8,056 |
Source: Public Records
About Dublin Terrace
Map
Nearby Homes
- 1365 Columbine St Unit 407
- 1365 Columbine St Unit 206
- 1365 Columbine St Unit 204
- 1350 Josephine St Unit 101
- 1350 Josephine St Unit 401
- 1284 Columbine St Unit 2
- 1437 Columbine St
- 1330 York St
- 1423 Elizabeth St
- 2607 E 14th Ave Unit 2607
- 1429 Josephine St
- 1265 Elizabeth St Unit 305
- 1265 Elizabeth St Unit 207
- 1260 York St Unit 208
- 1245 Columbine St Unit 101
- 1245 Columbine St Unit 306
- 1471 Josephine St
- 1230 Josephine St
- 1204 Columbine St Unit 1206
- 1424 Clayton St
- 1350 Josephine St Unit 409
- 1350 Josephine St Unit 601
- 1350 Josephine St Unit 510
- 1350 Josephine St Unit 509
- 1350 Josephine St
- 1350 Josephine St
- 1350 Josephine St Unit 506
- 1350 Josephine St Unit 505
- 1350 Josephine St Unit 504
- 1350 Josephine St Unit 503
- 1350 Josephine St Unit 501
- 1350 Josephine St Unit 410
- 1350 Josephine St
- 1350 Josephine St
- 1350 Josephine St
- 1350 Josephine St Unit 405
- 1350 Josephine St
- 1350 Josephine St Unit 403
- 1350 Josephine St Unit 402
- 1350 Josephine St