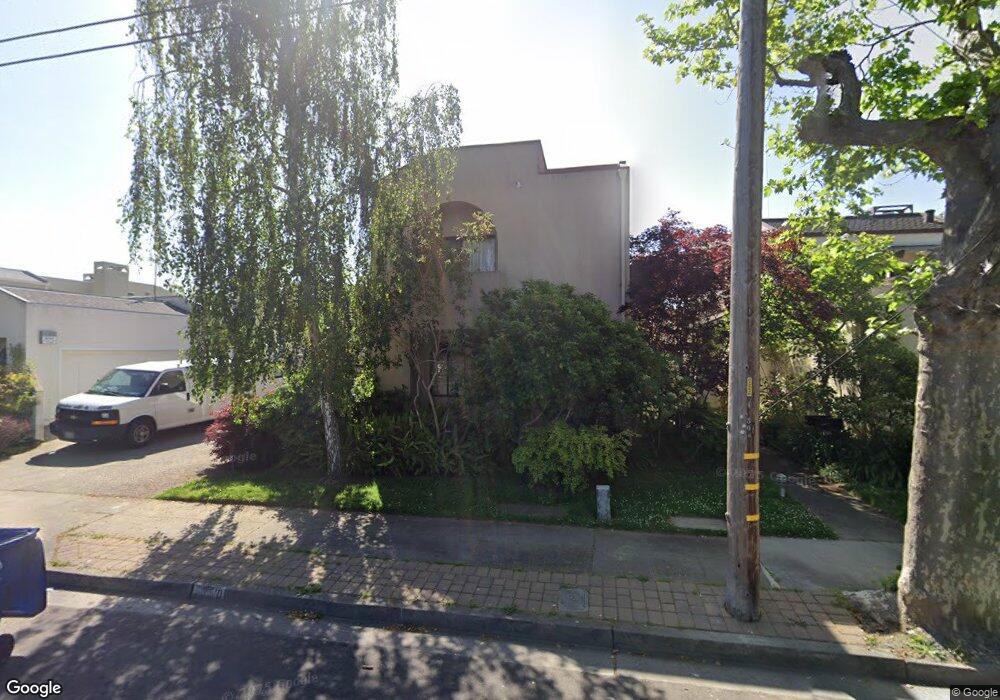
1350 Mound St Alameda, CA 94501
Downtown Alameda NeighborhoodEstimated Value: $1,210,000 - $1,797,000
3
Beds
3
Baths
2,561
Sq Ft
$628/Sq Ft
Est. Value
About This Home
This home is located at 1350 Mound St, Alameda, CA 94501 and is currently estimated at $1,607,460, approximately $627 per square foot. 1350 Mound St is a home located in Alameda County with nearby schools including Frank Otis Elementary School, Lincoln Middle School, and Alameda High School.
Ownership History
Date
Name
Owned For
Owner Type
Purchase Details
Closed on
May 21, 2013
Sold by
Carney Jason A
Bought by
Carney Jason A and Carney Jasona 2013 Revocable T
Current Estimated Value
Purchase Details
Closed on
Nov 17, 2012
Sold by
Macpherson Carney Jason A and Macpherson Carney Kavenaugh
Bought by
Carney Jason A
Purchase Details
Closed on
Mar 15, 2006
Sold by
Carney Carney Jason A Jason A and Carney Jason A
Bought by
Macpherson Carney Jason A and Macpherson Carney Kavenaugh
Purchase Details
Closed on
Dec 28, 2001
Sold by
Carney Jason and Carney Suzanne
Bought by
Carney Jason A and Carney Suzanne W
Create a Home Valuation Report for This Property
The Home Valuation Report is an in-depth analysis detailing your home's value as well as a comparison with similar homes in the area
Home Values in the Area
Average Home Value in this Area
Purchase History
| Date | Buyer | Sale Price | Title Company |
|---|---|---|---|
| Carney Jason A | -- | None Available | |
| Carney Jason A | -- | None Available | |
| Macpherson Carney Jason A | -- | None Available | |
| Carney Jason A | -- | -- |
Source: Public Records
Tax History Compared to Growth
Tax History
| Year | Tax Paid | Tax Assessment Tax Assessment Total Assessment is a certain percentage of the fair market value that is determined by local assessors to be the total taxable value of land and additions on the property. | Land | Improvement |
|---|---|---|---|---|
| 2025 | $9,640 | $578,950 | $175,785 | $410,165 |
| 2024 | $9,640 | $567,460 | $172,338 | $402,122 |
| 2023 | $9,304 | $563,198 | $168,959 | $394,239 |
| 2022 | $9,109 | $545,156 | $165,647 | $386,509 |
| 2021 | $8,906 | $534,330 | $162,399 | $378,931 |
| 2020 | $8,804 | $535,780 | $160,734 | $375,046 |
| 2019 | $8,014 | $525,274 | $157,582 | $367,692 |
| 2018 | $7,822 | $514,976 | $154,493 | $360,483 |
| 2017 | $7,489 | $504,880 | $151,464 | $353,416 |
| 2016 | $7,489 | $494,983 | $148,495 | $346,488 |
| 2015 | $7,461 | $487,551 | $146,265 | $341,286 |
| 2014 | $7,098 | $478,002 | $143,400 | $334,602 |
Source: Public Records
Map
Nearby Homes
- 1314 Mound St
- 1416 Versailles Ave
- 1354 Regent St
- 1601 Broadway Unit 9
- 3171 Bayview Dr
- 1251 Park St
- 2312 San Antonio Ave
- 1100 Park Ave
- 954 Park St
- 840 Oak St
- 1611 Lea Ct
- 2853 Regatta Dr Unit 179
- 3090 Glascock St Unit 102
- 1720 Walnut St
- 340 29th Ave Unit 207
- 340 29th Ave Unit 204
- 2959 Sea View Pkwy
- 0 Lancaster St
- 2106 Otis Dr Unit A
- 2031 Otis Dr Unit H