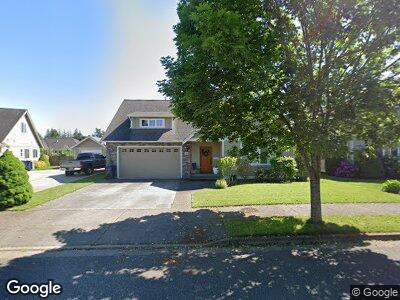
1350 Pearl Loop Lynden, WA 98264
Estimated Value: $578,569 - $620,000
3
Beds
3
Baths
1,911
Sq Ft
$316/Sq Ft
Est. Value
About This Home
This home is located at 1350 Pearl Loop, Lynden, WA 98264 and is currently estimated at $603,642, approximately $315 per square foot. 1350 Pearl Loop is a home located in Whatcom County with nearby schools including Lynden High School, Lynden Christian School, and Lynden Christian Schools: Administration.
Ownership History
Date
Name
Owned For
Owner Type
Purchase Details
Closed on
May 30, 2023
Sold by
Keller Timothy
Bought by
Powell Kimberly A
Current Estimated Value
Purchase Details
Closed on
Sep 15, 2017
Sold by
Keller Karl
Bought by
Powell Kimberly A
Purchase Details
Closed on
Jul 6, 2016
Sold by
Keller Karl
Bought by
Keller Karl and Keller Timothy A
Purchase Details
Closed on
Sep 27, 2010
Sold by
Tabert Homes Inc
Bought by
Keller Judy and Keller Karl
Home Financials for this Owner
Home Financials are based on the most recent Mortgage that was taken out on this home.
Original Mortgage
$195,000
Interest Rate
4.35%
Mortgage Type
Future Advance Clause Open End Mortgage
Purchase Details
Closed on
Dec 14, 2009
Sold by
Duke Development Corporation
Bought by
Tabert Homes Inc
Create a Home Valuation Report for This Property
The Home Valuation Report is an in-depth analysis detailing your home's value as well as a comparison with similar homes in the area
Home Values in the Area
Average Home Value in this Area
Purchase History
| Date | Buyer | Sale Price | Title Company |
|---|---|---|---|
| Powell Kimberly A | -- | None Listed On Document | |
| Powell Kimberly A | -- | None Available | |
| Keller Karl | -- | None Available | |
| Keller Judy | $260,280 | Chicago Title Insurance | |
| Tabert Homes Inc | $59,280 | Chicago Title Insurance |
Source: Public Records
Mortgage History
| Date | Status | Borrower | Loan Amount |
|---|---|---|---|
| Previous Owner | Keller Timothy | $136,500 | |
| Previous Owner | Keller Judy | $195,000 | |
| Previous Owner | Tabert Homes Inc | $100,000 |
Source: Public Records
Tax History Compared to Growth
Tax History
| Year | Tax Paid | Tax Assessment Tax Assessment Total Assessment is a certain percentage of the fair market value that is determined by local assessors to be the total taxable value of land and additions on the property. | Land | Improvement |
|---|---|---|---|---|
| 2024 | $3,482 | $490,028 | $194,000 | $296,028 |
| 2023 | $3,482 | $484,642 | $200,000 | $284,642 |
| 2022 | $3,476 | $456,615 | $135,383 | $321,232 |
| 2021 | $3,410 | $377,363 | $111,885 | $265,478 |
| 2020 | $2,987 | $336,940 | $99,900 | $237,040 |
| 2019 | $2,657 | $309,012 | $91,725 | $217,287 |
| 2018 | $2,904 | $281,821 | $83,558 | $198,263 |
| 2017 | $2,595 | $252,958 | $75,000 | $177,958 |
| 2016 | $2,444 | $240,422 | $60,500 | $179,922 |
| 2015 | $2,167 | $225,277 | $58,190 | $167,087 |
| 2014 | -- | $217,647 | $56,210 | $161,437 |
| 2013 | -- | $216,437 | $55,000 | $161,437 |
Source: Public Records
Map
Nearby Homes
- 224 W Maberry Dr Unit 103
- 137 E Cedar Dr
- 301 S Park St
- 1524 Camelia Ct
- 8658 Brookfield Dr
- 785 Sunrise Dr
- 805 S Park Ct
- 8620 Bender Rd
- 840 W Park Dr
- 8844 Depot Rd Unit B112
- 814 N Park St
- 325 Island Green Way
- 714 N 8th St
- 604 Main St Unit 1-6
- 449 Island Green Way
- 8889 Depot Rd
- 8457 Benson Rd
- 2200 Greenview Cir Unit 39
- 104 Riverwalk Dr
- 208 Riverwalk Dr
- 1350 Pearl Loop
- 1342 Pearl Loop
- 18 Pearl Lp
- 14 Pearl Lp
- 17 Pearl Lp
- 15 Pearl Lp
- 16 Pearl Lp
- 1358 Pearl Loop
- 216 Springview Dr
- 218 Springview Dr
- 1334 Pearl Loop
- 1361 Pearl Loop
- 214 Springview Dr
- 220 Springview Dr
- 1337 Pearl Loop
- 1366 Pearl Loop
- 1326 Pearl Loop Unit A & B
- 1326 Pearl Loop
- 212 Springview Dr
- 1377 Pearl Loop