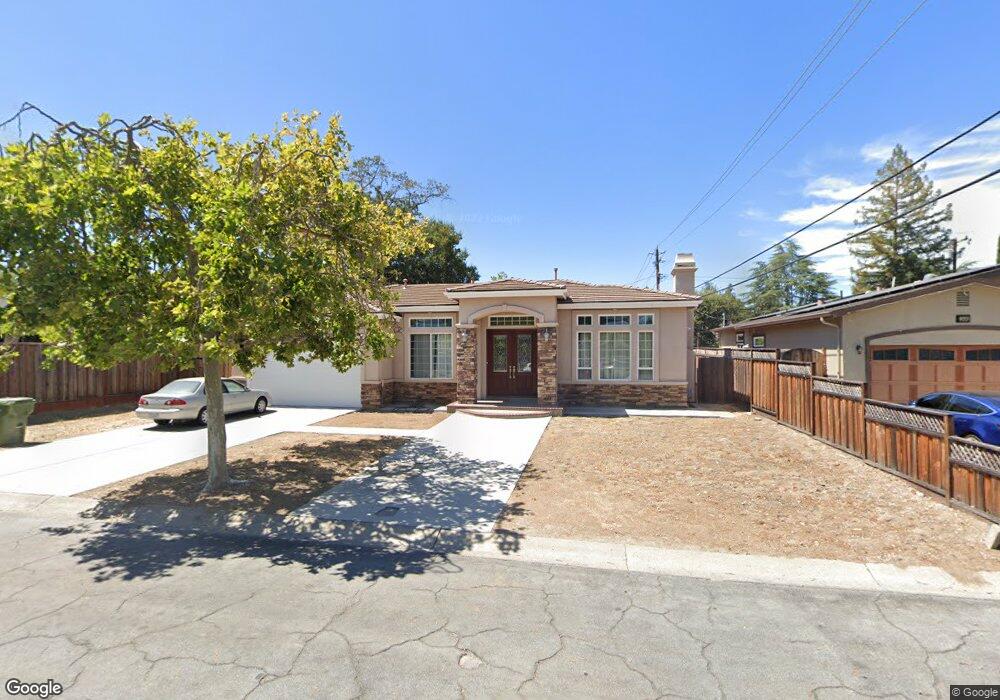
13501 Ward Way Saratoga, CA 95070
Saratoga Gardens NeighborhoodEstimated Value: $2,221,000 - $4,099,000
4
Beds
3
Baths
2,626
Sq Ft
$1,329/Sq Ft
Est. Value
About This Home
This home is located at 13501 Ward Way, Saratoga, CA 95070 and is currently estimated at $3,489,440, approximately $1,328 per square foot. 13501 Ward Way is a home located in Santa Clara County with nearby schools including Argonaut Elementary School, Saratoga Elementary School, and Foothill Elementary School.
Ownership History
Date
Name
Owned For
Owner Type
Purchase Details
Closed on
Jul 20, 2014
Sold by
Huang Daniel Tri and Chu Pohrong Rita
Bought by
Daniel Huang & Pohrong Chu 2014 Living T and Chu Pohrong Rita
Current Estimated Value
Purchase Details
Closed on
Mar 4, 2002
Sold by
Jeng Terry and Jeng Sheng Jui
Bought by
Huang Daniel Tri and Chu Pohrong Rita
Home Financials for this Owner
Home Financials are based on the most recent Mortgage that was taken out on this home.
Original Mortgage
$500,000
Outstanding Balance
$207,099
Interest Rate
6.94%
Estimated Equity
$3,282,341
Purchase Details
Closed on
Jul 25, 2000
Sold by
Chih Jeng Tsung and Jui Sheng
Bought by
Jeng Terry and Jeng Sheng Jui
Purchase Details
Closed on
Feb 20, 1998
Sold by
Ditto Jerry R and Ditto Sarah I
Bought by
Jeng Tsung Chih and Jeng Sheng Jui
Home Financials for this Owner
Home Financials are based on the most recent Mortgage that was taken out on this home.
Original Mortgage
$325,500
Interest Rate
6.9%
Create a Home Valuation Report for This Property
The Home Valuation Report is an in-depth analysis detailing your home's value as well as a comparison with similar homes in the area
Home Values in the Area
Average Home Value in this Area
Purchase History
| Date | Buyer | Sale Price | Title Company |
|---|---|---|---|
| Daniel Huang & Pohrong Chu 2014 Living T | -- | None Available | |
| Huang Daniel Tri | $675,000 | Alliance Title Company | |
| Jeng Terry | -- | -- | |
| Jeng Tsung Chih | $465,000 | First American Title Guarant | |
| Ditto Jerry R | -- | First American Title Guarant |
Source: Public Records
Mortgage History
| Date | Status | Borrower | Loan Amount |
|---|---|---|---|
| Open | Huang Daniel Tri | $500,000 | |
| Previous Owner | Jeng Tsung Chih | $325,500 |
Source: Public Records
Tax History Compared to Growth
Tax History
| Year | Tax Paid | Tax Assessment Tax Assessment Total Assessment is a certain percentage of the fair market value that is determined by local assessors to be the total taxable value of land and additions on the property. | Land | Improvement |
|---|---|---|---|---|
| 2025 | $20,129 | $1,690,063 | $812,506 | $877,557 |
| 2024 | $20,129 | $1,656,925 | $796,575 | $860,350 |
| 2023 | $20,129 | $1,624,437 | $780,956 | $843,481 |
| 2022 | $19,525 | $1,592,587 | $765,644 | $826,943 |
| 2021 | $19,200 | $1,561,361 | $750,632 | $810,729 |
| 2020 | $18,794 | $1,545,352 | $742,936 | $802,416 |
| 2019 | $18,474 | $1,515,052 | $728,369 | $786,683 |
| 2018 | $18,149 | $1,485,346 | $714,088 | $771,258 |
| 2017 | $18,075 | $1,456,223 | $700,087 | $756,136 |
| 2016 | $17,546 | $1,427,670 | $686,360 | $741,310 |
| 2015 | $17,195 | $1,406,226 | $676,051 | $730,175 |
| 2014 | $16,827 | $1,378,681 | $662,809 | $715,872 |
Source: Public Records
Map
Nearby Homes
- 13550 Myren Dr
- 13446 Alvarado Ct
- 19113 Vineyard Ln
- 19423 Vineyard Ln
- 18732 Afton Ave
- 19437 Via Real Dr
- 11010 Maple Place Unit 25-06 Plan 4
- 10875 Elm Cir Unit 68-14 Plan 2
- 18677 Mccoy Ave
- 10730 Elm Cir Unit 86-17 Plan 2
- 19522 Via Real Dr
- 10740 Elm Cir Unit 87-17 Plan 2
- 10750 Elm Cir Unit 88-17 Plan 2
- 14001 Chester Ave
- 13010 Glen Brae Dr
- Plan 4 at The Elms
- Plan 2 at The Elms
- Plan 3 at The Elms
- 19662 Via Grande Dr
- 11115 Maple Place Unit 30-07
- 13491 Ward Way
- 19145 Buckingham Ct
- 13472 Harper Dr
- 13464 Harper Dr
- 19155 Buckingham Ct
- 13481 Ward Way
- 13500 Ward Way
- 13490 Ward Way
- 13456 Harper Dr
- 19131 Portos Dr
- 19141 Portos Dr
- 13473 Ward Way
- 13480 Ward Way
- 19161 Portos Dr
- 13448 Harper Dr
- 19181 Portos Place
- 19121 Portos Dr
- 13472 Ward Way
- 13545 Holiday Dr
- 13475 Harper Dr