Estimated Value: $911,000 - $1,076,000
3
Beds
2
Baths
1,222
Sq Ft
$811/Sq Ft
Est. Value
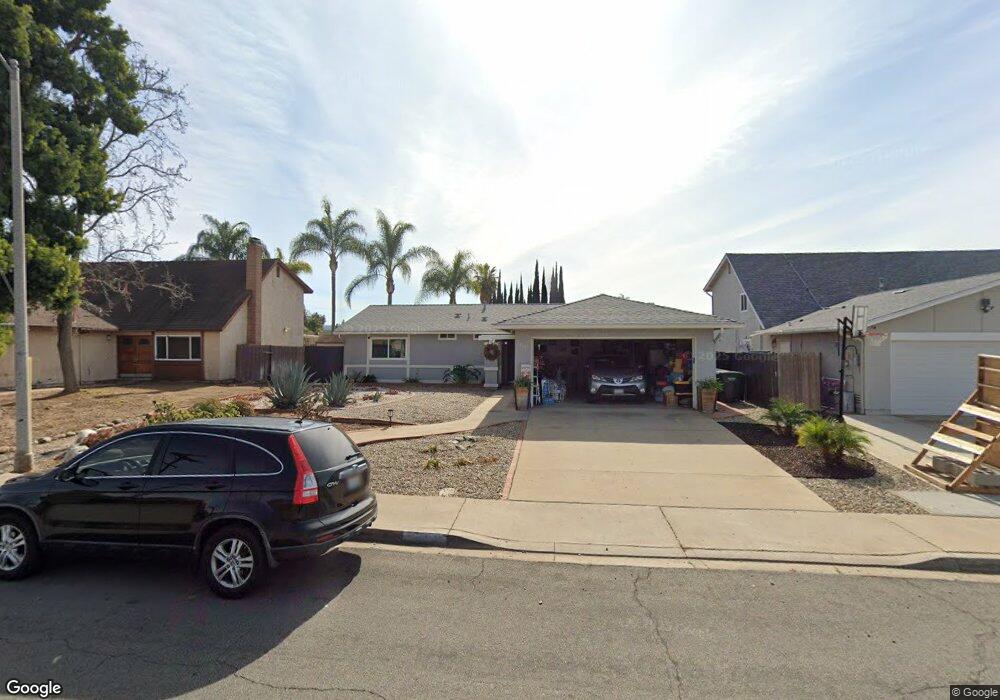
About This Home
This home is located at 13503 Scots Way, Poway, CA 92064 and is currently estimated at $991,050, approximately $811 per square foot. 13503 Scots Way is a home located in San Diego County with nearby schools including Midland Elementary, Twin Peaks Middle, and Poway High.
Ownership History
Date
Name
Owned For
Owner Type
Purchase Details
Closed on
Apr 12, 2000
Sold by
Smjt Zegler Dawn and Delay Jon A
Bought by
Johnson Kathleen
Current Estimated Value
Home Financials for this Owner
Home Financials are based on the most recent Mortgage that was taken out on this home.
Original Mortgage
$140,000
Outstanding Balance
$48,032
Interest Rate
8.25%
Estimated Equity
$943,018
Purchase Details
Closed on
May 21, 1997
Sold by
Hunter Donald R
Bought by
Delay Jon A and Zegler Dawn
Home Financials for this Owner
Home Financials are based on the most recent Mortgage that was taken out on this home.
Original Mortgage
$150,100
Interest Rate
7.91%
Purchase Details
Closed on
Aug 5, 1986
Create a Home Valuation Report for This Property
The Home Valuation Report is an in-depth analysis detailing your home's value as well as a comparison with similar homes in the area
Home Values in the Area
Average Home Value in this Area
Purchase History
| Date | Buyer | Sale Price | Title Company |
|---|---|---|---|
| Johnson Kathleen | $240,000 | Commonwealth Land Title Co | |
| Delay Jon A | $158,000 | Chicago Title | |
| -- | $110,700 | -- |
Source: Public Records
Mortgage History
| Date | Status | Borrower | Loan Amount |
|---|---|---|---|
| Open | Johnson Kathleen | $140,000 | |
| Previous Owner | Delay Jon A | $150,100 |
Source: Public Records
Tax History
| Year | Tax Paid | Tax Assessment Tax Assessment Total Assessment is a certain percentage of the fair market value that is determined by local assessors to be the total taxable value of land and additions on the property. | Land | Improvement |
|---|---|---|---|---|
| 2025 | $4,175 | $377,896 | $215,170 | $162,726 |
| 2024 | $4,175 | $370,487 | $210,951 | $159,536 |
| 2023 | $4,086 | $363,223 | $206,815 | $156,408 |
| 2022 | $4,017 | $356,102 | $202,760 | $153,342 |
| 2021 | $3,964 | $349,121 | $198,785 | $150,336 |
| 2020 | $3,911 | $345,542 | $196,747 | $148,795 |
| 2019 | $3,810 | $338,768 | $192,890 | $145,878 |
| 2018 | $3,703 | $332,126 | $189,108 | $143,018 |
| 2017 | $170 | $325,614 | $185,400 | $140,214 |
| 2016 | $3,530 | $319,230 | $181,765 | $137,465 |
| 2015 | $3,477 | $314,436 | $179,035 | $135,401 |
| 2014 | $3,396 | $308,277 | $175,528 | $132,749 |
Source: Public Records
Map
Nearby Homes
- 13422 Little Dawn Ln
- 000 Carlson Ct 9 Unit 9
- 13619 Sycamore Tree Ln
- 13947 Midland Rd
- 13908 Hibiscus Ave Unit 40
- 13941 Wisteria Ave
- 14003 Jasmine Ave Unit 193
- 14089 Pomegranate Ave Unit 214
- 13650 Mulberry Tree Ct Unit 167
- 13643 Melissa Ln
- 13483 Pequot Dr
- 13303 Betty Lee Way
- 12885 Rockwell Ct
- 13056 Poway Rd
- 12939 Cree Ct
- 1/2 Poway Rd
- 13735 Fairgate Dr
- 14403 Gaslight Ct
- 13087 Olympus Cir Unit 2
- 12959 Creek Park Dr
- 13443 Scots Way
- 13511 Scots Way
- 13756 Buford Way
- 13761 Buford Way
- 13519 Scots Way
- 13767 Mckenzie Ave
- 13759 Mckenzie Ave
- 13514 Scots Way
- 13751 Mckenzie Ave
- 13755 Buford Way
- 13748 Buford Way
- 13832 Wayland Grove Ct
- 13824 Wayland Grove Ct
- 13436 Scots Way
- 13743 Mckenzie Ave
- 13849 York Ave
- 13740 Buford Way
- 13749 Buford Way
- 13816 Wayland Grove Ct
- 13846 Wayland Grove Ct
Your Personal Tour Guide
Ask me questions while you tour the home.