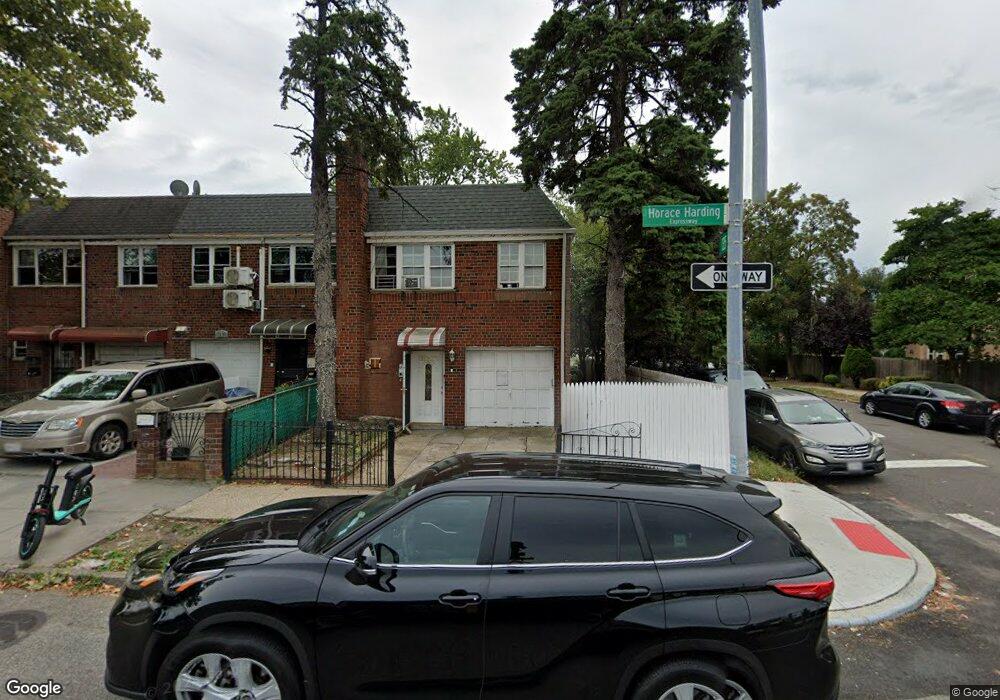
13504 Horace Harding Expy Flushing, NY 11367
Flushing NeighborhoodEstimated Value: $950,578 - $1,129,000
--
Bed
--
Bath
1,720
Sq Ft
$616/Sq Ft
Est. Value
About This Home
This home is located at 13504 Horace Harding Expy, Flushing, NY 11367 and is currently estimated at $1,059,895, approximately $616 per square foot. 13504 Horace Harding Expy is a home located in Queens County with nearby schools including I.S. 250 - The Robert F. Kennedy Community Middle School, John Bowne High School, and The Lowell School.
Ownership History
Date
Name
Owned For
Owner Type
Purchase Details
Closed on
Nov 8, 2018
Sold by
Suquisupa Angel R and Suquisupa Irma
Bought by
Yu Yi Xiang and Zheng Feng
Current Estimated Value
Home Financials for this Owner
Home Financials are based on the most recent Mortgage that was taken out on this home.
Original Mortgage
$560,000
Outstanding Balance
$489,437
Interest Rate
4.7%
Mortgage Type
New Conventional
Estimated Equity
$570,458
Purchase Details
Closed on
Dec 27, 2004
Sold by
Quinde Luis and Suquisupa Angel R
Bought by
Suquisupa Angel R and Suquisupa Irma
Purchase Details
Closed on
Mar 14, 2003
Sold by
Wang An-Yin and Wang Hong
Bought by
Quinde Luis and Suquisupa Angel R
Purchase Details
Closed on
Apr 23, 1999
Sold by
Chang Juliet and Seet Mei Hua
Bought by
Wang Hong and Wang An Yin
Create a Home Valuation Report for This Property
The Home Valuation Report is an in-depth analysis detailing your home's value as well as a comparison with similar homes in the area
Home Values in the Area
Average Home Value in this Area
Purchase History
| Date | Buyer | Sale Price | Title Company |
|---|---|---|---|
| Yu Yi Xiang | $800,000 | -- | |
| Yu Yi Xiang | $800,000 | -- | |
| Yu Yi Xiang | $800,000 | -- | |
| Suquisupa Angel R | -- | -- | |
| Suquisupa Angel R | -- | -- | |
| Quinde Luis | $360,000 | -- | |
| Quinde Luis | $360,000 | -- | |
| Wang Hong | $158,500 | Chicago Title Insurance Co | |
| Wang Hong | $158,500 | Chicago Title Insurance Co |
Source: Public Records
Mortgage History
| Date | Status | Borrower | Loan Amount |
|---|---|---|---|
| Open | Yu Yi Xiang | $560,000 | |
| Closed | Yu Yi Xiang | $560,000 | |
| Closed | Quinde Luis | $0 |
Source: Public Records
Tax History Compared to Growth
Tax History
| Year | Tax Paid | Tax Assessment Tax Assessment Total Assessment is a certain percentage of the fair market value that is determined by local assessors to be the total taxable value of land and additions on the property. | Land | Improvement |
|---|---|---|---|---|
| 2025 | $7,576 | $39,982 | $5,628 | $34,354 |
| 2024 | $7,576 | $37,722 | $5,742 | $31,980 |
| 2023 | $7,576 | $37,722 | $5,264 | $32,458 |
| 2022 | $5,605 | $51,600 | $8,640 | $42,960 |
| 2021 | $7,432 | $55,200 | $8,640 | $46,560 |
| 2020 | $7,052 | $60,660 | $8,640 | $52,020 |
| 2019 | $6,576 | $59,820 | $8,640 | $51,180 |
| 2018 | $5,132 | $31,435 | $5,723 | $25,712 |
| 2017 | $5,472 | $31,195 | $6,426 | $24,769 |
| 2016 | $4,990 | $31,195 | $6,426 | $24,769 |
| 2015 | $3,008 | $27,765 | $6,920 | $20,845 |
| 2014 | $3,008 | $26,196 | $7,733 | $18,463 |
Source: Public Records
Map
Nearby Homes
- 132-56 60th Ave
- 61-31 136th St
- 13214 Horace Harding Expy
- 13506 62nd Rd
- 132-20 60th Ave
- 132-25 60th Ave
- 136-28 62nd Ave
- 13403 59th Ave
- 58-15 134th St
- 130-42 59th Ave
- 136-43 58th Rd
- 5739 134th St
- 6339 136th St
- 63-05 138th St
- 63-09 138th St
- 130-14 60th Ave Unit 2E
- 13219 58th Ave
- 61-12 Main St
- 13420 57th Ave
- 58-04 Main St Unit 1A
- 13506 Horace Harding Expy
- 135-06 Horace Harding Expy Unit 1
- 135-06 Horace Harding Expy Unit 2nd Fl
- 13504 Horace Harding Expy
- 13504 Horace Harding Expy Unit 2Fl
- 13504 Horace Harding Expy Unit 1Fl
- 13508 Horace Harding Expy
- 135-08 Horace Harding Expy
- 13510 Horace Harding Expy
- 135-8 Horace Harding Expy
- 13512 Horace Harding Expy
- 135-12 Horace Harding Expy Unit 2Fl
- 13523 135th St Unit A
- 13416 Horace Harding Expy
- 13514 Horace Harding Expy
- 135-02 61st Rd
- 13516 Horace Harding Expy
- 135-10 61st Rd
- 13518 Horace Harding Expy
- 135-18 Horace Harding Expy