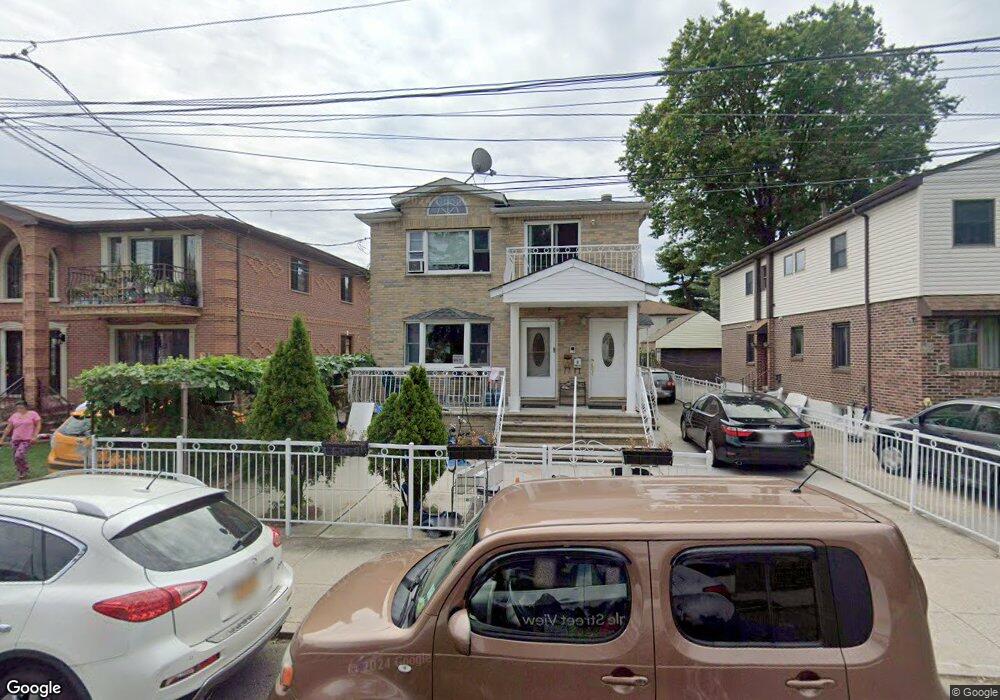
13506 62nd Ave Flushing, NY 11367
Flushing NeighborhoodEstimated Value: $1,438,000 - $1,766,000
--
Bed
--
Bath
2,400
Sq Ft
$674/Sq Ft
Est. Value
About This Home
This home is located at 13506 62nd Ave, Flushing, NY 11367 and is currently estimated at $1,617,010, approximately $673 per square foot. 13506 62nd Ave is a home located in Queens County with nearby schools including I.S. 250 - The Robert F. Kennedy Community Middle School, John Bowne High School, and The Lowell School.
Ownership History
Date
Name
Owned For
Owner Type
Purchase Details
Closed on
Jan 31, 2017
Sold by
Lam Luen Luen and Lin-Lo Sau Ching
Bought by
Lam Luen Luen and Lam Ho-Ho
Current Estimated Value
Purchase Details
Closed on
Jul 29, 2008
Sold by
Lam Luen Luen and Lin Bao Kang
Bought by
Lam Luen Luen and Lin-Lo Sau Ching
Purchase Details
Closed on
Oct 28, 2005
Sold by
Barak John
Bought by
Lam Luen Luen and Lin Bao Kang
Home Financials for this Owner
Home Financials are based on the most recent Mortgage that was taken out on this home.
Original Mortgage
$450,000
Interest Rate
5.93%
Mortgage Type
Purchase Money Mortgage
Purchase Details
Closed on
Feb 16, 2001
Sold by
Hillenbrand Claire E and Hillenbrand Jane E
Bought by
Barak John W
Create a Home Valuation Report for This Property
The Home Valuation Report is an in-depth analysis detailing your home's value as well as a comparison with similar homes in the area
Home Values in the Area
Average Home Value in this Area
Purchase History
| Date | Buyer | Sale Price | Title Company |
|---|---|---|---|
| Lam Luen Luen | -- | -- | |
| Lam Luen Luen | -- | -- | |
| Lam Luen Luen | $835,000 | -- | |
| Barak John W | $165,000 | First American Title Ins Co |
Source: Public Records
Mortgage History
| Date | Status | Borrower | Loan Amount |
|---|---|---|---|
| Previous Owner | Lam Luen Luen | $450,000 |
Source: Public Records
Tax History Compared to Growth
Tax History
| Year | Tax Paid | Tax Assessment Tax Assessment Total Assessment is a certain percentage of the fair market value that is determined by local assessors to be the total taxable value of land and additions on the property. | Land | Improvement |
|---|---|---|---|---|
| 2025 | $14,518 | $76,550 | $11,505 | $65,045 |
| 2024 | $14,530 | $73,681 | $12,607 | $61,074 |
| 2023 | $13,680 | $69,511 | $11,585 | $57,926 |
| 2022 | $12,804 | $91,020 | $15,420 | $75,600 |
| 2021 | $13,505 | $76,680 | $15,420 | $61,260 |
| 2020 | $12,742 | $81,780 | $15,420 | $66,360 |
| 2019 | $12,552 | $83,100 | $15,420 | $67,680 |
| 2018 | $11,511 | $57,926 | $12,822 | $45,104 |
| 2017 | $10,840 | $54,648 | $13,363 | $41,285 |
| 2016 | $10,607 | $54,648 | $13,363 | $41,285 |
| 2015 | $5,998 | $53,160 | $17,160 | $36,000 |
| 2014 | $5,998 | $51,168 | $15,535 | $35,633 |
Source: Public Records
Map
Nearby Homes
- 13506 62nd Rd
- 61-31 136th St
- 136-28 62nd Ave
- 132-56 60th Ave
- 6339 136th St
- 13214 Horace Harding Expy
- 63-05 138th St
- 63-09 138th St
- 132-20 60th Ave
- 132-25 60th Ave
- 13403 59th Ave
- 61-12 Main St
- 6431 138th St
- 64-35 138th St
- 58-15 134th St
- 138-65 63rd Ave
- 130-42 59th Ave
- 136-43 58th Rd
- 130-14 60th Ave Unit 2E
- 5739 134th St
- 13502 62nd Ave
- 135-02 62nd Ave Unit 2
- 13514 62nd Ave
- 135-2 62nd Ave Unit 2
- 69 62nd Ave Unit 1
- 13507 62nd Rd
- 13501 62nd Rd
- 13511 62nd Rd
- 13518 62nd Ave
- 135-18 62nd Ave
- 13503 62nd Ave
- 135-11 62nd Rd
- 13515 62nd Rd
- 13507 62nd Ave
- 13522 62nd Ave
- 13515 62nd Rd
- 13503 62nd Ave
- 13511 62nd Ave
- 13507 62nd Ave Unit 2FL