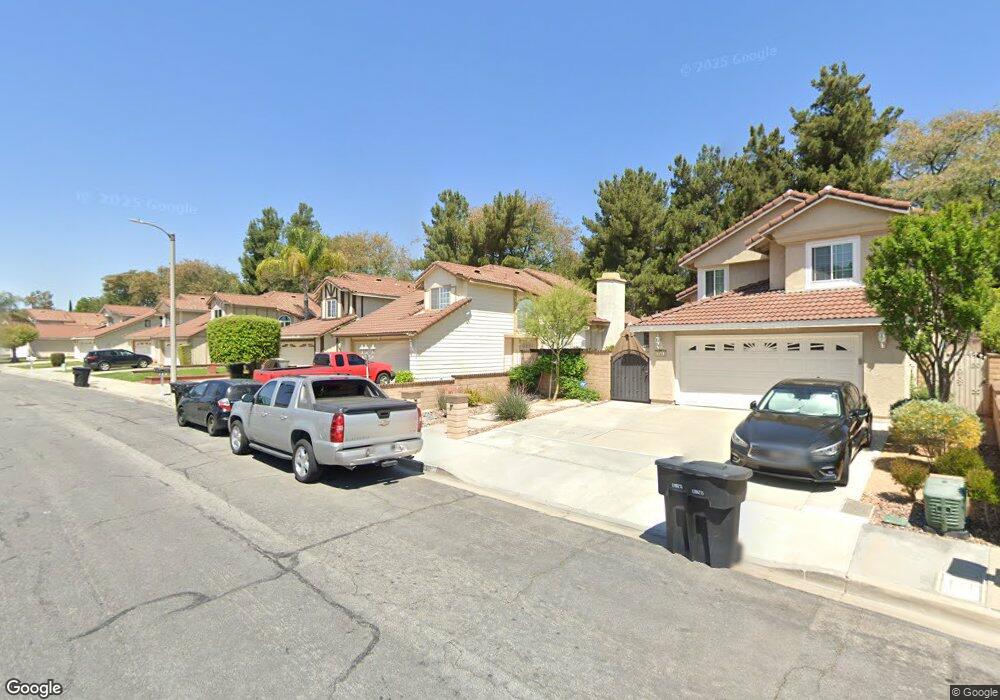
13507 Treasure Way Chino Hills, CA 91709
North Chino Hills NeighborhoodEstimated Value: $940,035 - $1,058,000
4
Beds
3
Baths
1,793
Sq Ft
$560/Sq Ft
Est. Value
About This Home
This home is located at 13507 Treasure Way, Chino Hills, CA 91709 and is currently estimated at $1,004,509, approximately $560 per square foot. 13507 Treasure Way is a home located in San Bernardino County with nearby schools including Eagle Canyon Elementary School, Canyon Hills Junior High School, and Ruben S. Ayala High School.
Ownership History
Date
Name
Owned For
Owner Type
Purchase Details
Closed on
Mar 18, 2020
Sold by
Gonzalez Enrique
Bought by
Gonzalez Enrique and Gonzalez Maria Celina
Current Estimated Value
Purchase Details
Closed on
Jun 5, 2018
Sold by
Gonzalez Maria Celina
Bought by
Gonzalez Enrique
Purchase Details
Closed on
Jun 15, 1998
Sold by
Ritchey Joseph D and Ritchey Darlene
Bought by
Gonzalez Enrique and Gonzalez Maria Celina
Home Financials for this Owner
Home Financials are based on the most recent Mortgage that was taken out on this home.
Original Mortgage
$149,500
Outstanding Balance
$29,518
Interest Rate
6.9%
Estimated Equity
$974,991
Purchase Details
Closed on
Aug 19, 1996
Sold by
Ford David R and Ford Julie Ann
Bought by
Ritchey Joseph D and Ritchey Darlene
Home Financials for this Owner
Home Financials are based on the most recent Mortgage that was taken out on this home.
Original Mortgage
$166,500
Interest Rate
8.23%
Create a Home Valuation Report for This Property
The Home Valuation Report is an in-depth analysis detailing your home's value as well as a comparison with similar homes in the area
Home Values in the Area
Average Home Value in this Area
Purchase History
| Date | Buyer | Sale Price | Title Company |
|---|---|---|---|
| Gonzalez Enrique | -- | None Available | |
| Gonzalez Enrique | -- | None Available | |
| Gonzalez Enrique | $200,000 | Chicago Title Co | |
| Ritchey Joseph D | $185,000 | Continental Lawyers Title Co |
Source: Public Records
Mortgage History
| Date | Status | Borrower | Loan Amount |
|---|---|---|---|
| Open | Gonzalez Enrique | $149,500 | |
| Previous Owner | Ritchey Joseph D | $166,500 |
Source: Public Records
Tax History Compared to Growth
Tax History
| Year | Tax Paid | Tax Assessment Tax Assessment Total Assessment is a certain percentage of the fair market value that is determined by local assessors to be the total taxable value of land and additions on the property. | Land | Improvement |
|---|---|---|---|---|
| 2025 | $3,662 | $313,151 | $78,228 | $234,923 |
| 2024 | $3,662 | $307,011 | $76,694 | $230,317 |
| 2023 | $3,568 | $300,991 | $75,190 | $225,801 |
| 2022 | $3,548 | $295,090 | $73,716 | $221,374 |
| 2021 | $3,407 | $289,304 | $72,271 | $217,033 |
| 2020 | $3,365 | $286,338 | $71,530 | $214,808 |
| 2019 | $3,309 | $280,723 | $70,127 | $210,596 |
| 2018 | $3,241 | $275,219 | $68,752 | $206,467 |
| 2017 | $3,186 | $269,823 | $67,404 | $202,419 |
| 2016 | $2,993 | $264,532 | $66,082 | $198,450 |
| 2015 | $2,937 | $260,558 | $65,089 | $195,469 |
| 2014 | $2,882 | $255,454 | $63,814 | $191,640 |
Source: Public Records
Map
Nearby Homes
- 3107 Greenacre Rd
- 3185 Skyview Ridge
- 3030 Olympic View Dr
- 2936 Ridgecrest Cir
- 13639 Meadow Crest Dr
- 3048 Street of The Chimes
- 2741 Olympic View Dr
- 2694 Olympic View Dr
- 3516 Larkwood Dr
- 13263 Sonrisa Dr
- 3056 Giant Forest Loop
- 13952 Woodrose Ct
- 13199 Spire Cir
- 13184 Spire Cir
- 2638 Highridge Dr
- 13163 Pinnacle Ct
- 13798 Roswell Ave
- 13149 Pinnacle Ct
- 13115 Le Parc Unit 8
- 13104 Glen Ct Unit 14
- 13503 Treasure Way
- 13511 Treasure Way
- 13515 Treasure Way
- 13499 Treasure Way
- 13519 Treasure Way
- 13495 Treasure Way
- 13508 Treasure Way
- 13516 Treasure Way
- 13494 Treasure Way
- 13523 Treasure Way
- 13491 Treasure Way
- 13524 Treasure Way
- 13490 Treasure Way
- 13527 Treasure Way
- 3123 Greenacre Rd
- 13486 Treasure Way
- 3162 Sunset Vista
- 3122 Greenacre Rd
- 13533 Treasure Way
- 13483 Treasure Way