1351 Ajuga St Upland, CA 91784
Estimated Value: $947,905 - $1,008,000
4
Beds
3
Baths
2,918
Sq Ft
$334/Sq Ft
Est. Value
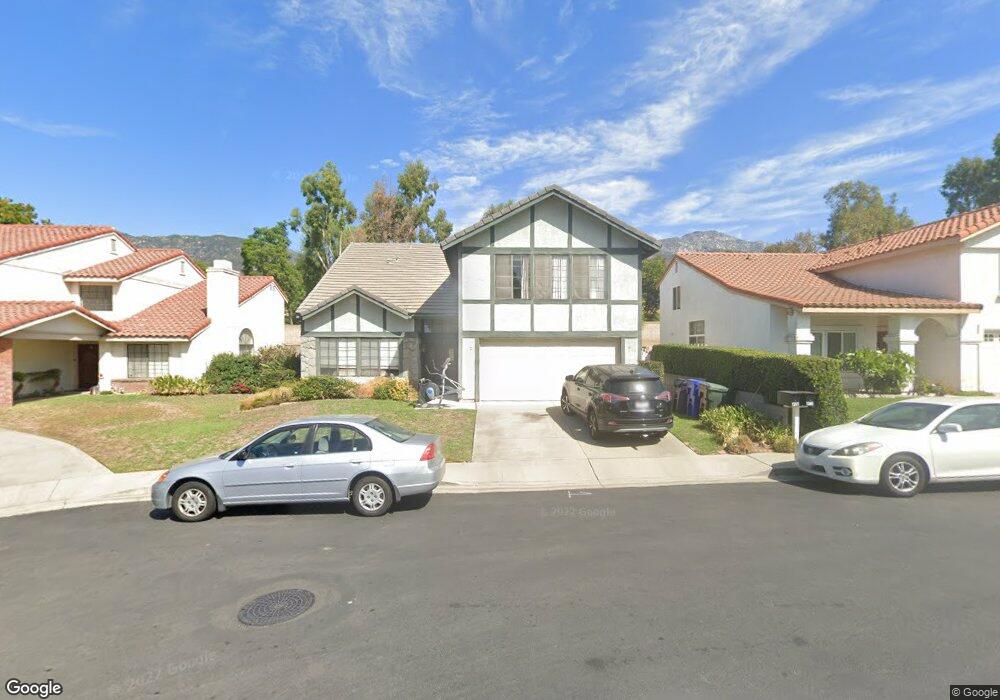
About This Home
This home is located at 1351 Ajuga St, Upland, CA 91784 and is currently estimated at $973,976, approximately $333 per square foot. 1351 Ajuga St is a home located in San Bernardino County with nearby schools including Pepper Tree Elementary, Pioneer Junior High School, and Upland High School.
Ownership History
Date
Name
Owned For
Owner Type
Purchase Details
Closed on
Dec 12, 2018
Sold by
Wasef Eman
Bought by
Wasef Eman George and The Eman George Trust
Current Estimated Value
Purchase Details
Closed on
Dec 11, 2018
Sold by
Wasef Medhat K and Wasef Eman
Bought by
Wasef Eman
Purchase Details
Closed on
Oct 10, 2000
Sold by
Rashidi Ali
Bought by
Wasef Medhat K and Wasef Eman
Home Financials for this Owner
Home Financials are based on the most recent Mortgage that was taken out on this home.
Original Mortgage
$150,000
Interest Rate
7.86%
Purchase Details
Closed on
Aug 18, 1993
Sold by
Mcmullen Walter John and Mcmullen Susan M
Bought by
Rashidi Ali
Home Financials for this Owner
Home Financials are based on the most recent Mortgage that was taken out on this home.
Original Mortgage
$171,000
Interest Rate
7.25%
Create a Home Valuation Report for This Property
The Home Valuation Report is an in-depth analysis detailing your home's value as well as a comparison with similar homes in the area
Home Values in the Area
Average Home Value in this Area
Purchase History
| Date | Buyer | Sale Price | Title Company |
|---|---|---|---|
| Wasef Eman George | -- | None Available | |
| Wasef Eman | -- | None Available | |
| Wasef Medhat K | $270,000 | First American Title Ins Co | |
| Rashidi Ali | $228,000 | Fidelity National Title Insu |
Source: Public Records
Mortgage History
| Date | Status | Borrower | Loan Amount |
|---|---|---|---|
| Previous Owner | Wasef Medhat K | $150,000 | |
| Previous Owner | Rashidi Ali | $171,000 |
Source: Public Records
Tax History
| Year | Tax Paid | Tax Assessment Tax Assessment Total Assessment is a certain percentage of the fair market value that is determined by local assessors to be the total taxable value of land and additions on the property. | Land | Improvement |
|---|---|---|---|---|
| 2025 | $4,572 | $406,851 | $142,399 | $264,452 |
| 2024 | $4,427 | $398,874 | $139,607 | $259,267 |
| 2023 | $4,360 | $391,053 | $136,870 | $254,183 |
| 2022 | $4,266 | $383,385 | $134,186 | $249,199 |
| 2021 | $4,261 | $375,868 | $131,555 | $244,313 |
| 2020 | $4,145 | $372,014 | $130,206 | $241,808 |
| 2019 | $4,131 | $364,720 | $127,653 | $237,067 |
| 2018 | $4,032 | $357,569 | $125,150 | $232,419 |
| 2017 | $3,916 | $350,558 | $122,696 | $227,862 |
| 2016 | $3,711 | $343,684 | $120,290 | $223,394 |
| 2015 | $3,626 | $338,521 | $118,483 | $220,038 |
| 2014 | $3,533 | $331,890 | $116,162 | $215,728 |
Source: Public Records
Map
Nearby Homes
- 1279 Moss St
- 1239 Mallorca St
- 2257 Poppy Ave
- 1435 Lookout Ct
- 2166 Malati Cir
- 2326 Fairfield Way
- 2360 N Mountain Ave
- 1140 W 22nd St
- 1328 Sunrise Cir S
- 1214 Miller Ct
- 2415 Park Blvd
- 937 Emerson St
- 2521 Electric Ave
- 2335 N San Antonio Ave
- 2337 N San Antonio Ave
- 907 Pineridge St
- 2061 N Albright Ave
- 959 Kenwood St
- 2499 Sierra Dr
- 1063 W 19th St
- 1345 Ajuga St
- 2265 Lobelia Ave
- 1339 Ajuga St
- 2257 Lobelia Ave
- 2253 Lobelia Ave
- 2264 Ajuga Ave
- 2260 Ajuga Ave
- 2256 Ajuga Ave
- 2249 Lobelia Ave
- 2252 Ajuga Ave
- 2245 Lobelia Ave
- 2265 Jasmine Ave
- 2261 Jasmine Ave
- 2246 Ajuga Ave
- 1390 Daylily St
- 2255 Jasmine Ave
- 2253 Jasmine Ave
- 2239 Lobelia Ave
- 1344 Zinnia St
- 1352 Zinnia St
Your Personal Tour Guide
Ask me questions while you tour the home.