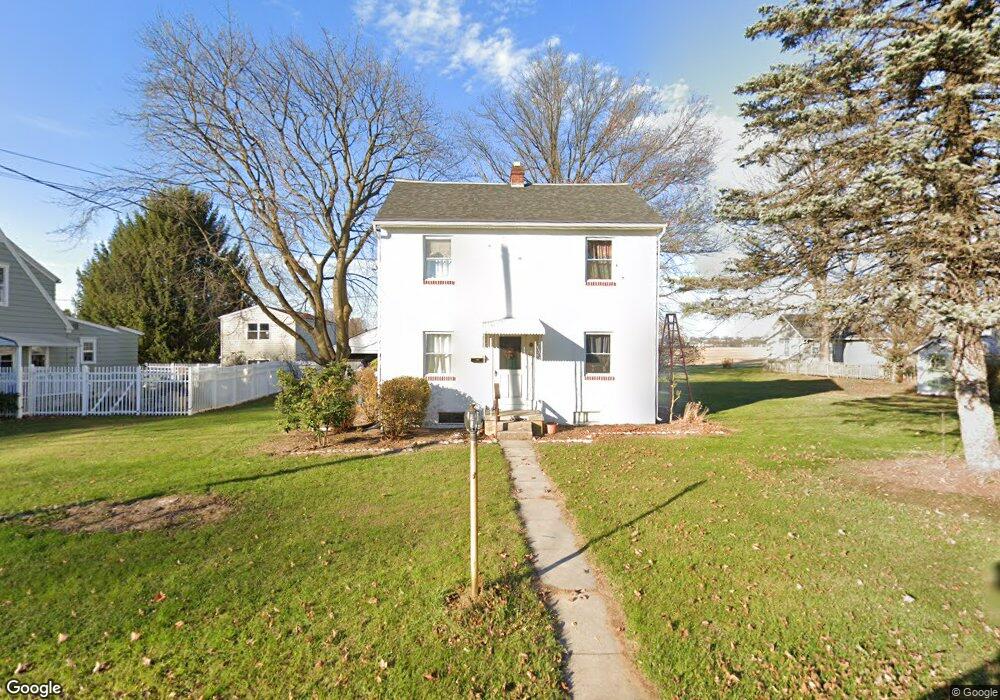
1351 E Derry Rd Hershey, PA 17033
Estimated Value: $287,000 - $310,000
3
Beds
1
Bath
1,144
Sq Ft
$260/Sq Ft
Est. Value
About This Home
This home is located at 1351 E Derry Rd, Hershey, PA 17033 and is currently estimated at $297,592, approximately $260 per square foot. 1351 E Derry Rd is a home located in Dauphin County with nearby schools including Hershey Elementary School, Hershey Primary Elementary School, and Hershey Middle School.
Ownership History
Date
Name
Owned For
Owner Type
Purchase Details
Closed on
Sep 27, 2011
Sold by
Serei Vuth
Bought by
Hammad Abigail H
Current Estimated Value
Home Financials for this Owner
Home Financials are based on the most recent Mortgage that was taken out on this home.
Original Mortgage
$107,200
Outstanding Balance
$73,291
Interest Rate
4.15%
Mortgage Type
New Conventional
Estimated Equity
$224,301
Purchase Details
Closed on
Oct 9, 2003
Sold by
Ball Thomas
Bought by
Kim Son
Home Financials for this Owner
Home Financials are based on the most recent Mortgage that was taken out on this home.
Original Mortgage
$126,897
Interest Rate
6.35%
Mortgage Type
FHA
Purchase Details
Closed on
Sep 26, 2003
Sold by
Ball Thomas
Bought by
Kim Son
Home Financials for this Owner
Home Financials are based on the most recent Mortgage that was taken out on this home.
Original Mortgage
$126,897
Interest Rate
6.35%
Mortgage Type
FHA
Create a Home Valuation Report for This Property
The Home Valuation Report is an in-depth analysis detailing your home's value as well as a comparison with similar homes in the area
Home Values in the Area
Average Home Value in this Area
Purchase History
| Date | Buyer | Sale Price | Title Company |
|---|---|---|---|
| Hammad Abigail H | $134,000 | -- | |
| Kim Son | $127,900 | -- | |
| Kim Son | $127,900 | -- |
Source: Public Records
Mortgage History
| Date | Status | Borrower | Loan Amount |
|---|---|---|---|
| Open | Hammad Abigail H | $107,200 | |
| Previous Owner | Kim Son | $126,897 | |
| Previous Owner | Kim Son | $126,897 |
Source: Public Records
Tax History
| Year | Tax Paid | Tax Assessment Tax Assessment Total Assessment is a certain percentage of the fair market value that is determined by local assessors to be the total taxable value of land and additions on the property. | Land | Improvement |
|---|---|---|---|---|
| 2025 | $2,782 | $89,000 | $37,100 | $51,900 |
| 2024 | $2,614 | $89,000 | $37,100 | $51,900 |
| 2023 | $2,568 | $89,000 | $37,100 | $51,900 |
| 2022 | $2,511 | $89,000 | $37,100 | $51,900 |
| 2021 | $2,511 | $89,000 | $37,100 | $51,900 |
| 2020 | $2,511 | $89,000 | $37,100 | $51,900 |
| 2019 | $2,465 | $89,000 | $37,100 | $51,900 |
| 2018 | $2,400 | $89,000 | $37,100 | $51,900 |
| 2017 | $2,400 | $89,000 | $37,100 | $51,900 |
| 2016 | $0 | $89,000 | $37,100 | $51,900 |
| 2015 | -- | $89,000 | $37,100 | $51,900 |
| 2014 | -- | $89,000 | $37,100 | $51,900 |
Source: Public Records
Map
Nearby Homes
- 125 N Roosevelt
- 708 W Cherry St
- 358 S Lingle Ave
- 804 E Chocolate Ave
- 1821 Wexford Rd
- 717 W Oak St
- 1937 Wexford Rd
- 501 W Oak St
- 1311 Cambridge Ct
- 301 Barrington Ct
- 305 Barrington Ct
- 217 W Rear W Maple St
- 26 Rye Ln
- 223 S Locust St
- 348 E Derry Rd
- 4 Evergreen Aly
- 13 Evergreen Aly
- 14 Willow St
- 308 E Derry Rd
- 22 Willow St
- 1361 E Derry Rd
- 1345 E Derry Rd
- 1339 E Derry Rd
- 1354 E Derry Rd
- 1350 E Derry Rd
- 1333 E Derry Rd
- 1403 E Derry Rd
- 1342 E Derry Rd
- 115 Roosevelt Ave
- 1338 E Derry Rd
- 1327 E Derry Rd
- 1334 E Derry Rd
- 1409 E Derry Rd
- 1404 E Derry Rd
- 1330 E Derry Rd
- 1415 E Derry Rd
- 1321 E Derry Rd
- 1412 E Derry Rd
- 1320 E Derry Rd
- 1359 Harding Ave
Your Personal Tour Guide
Ask me questions while you tour the home.