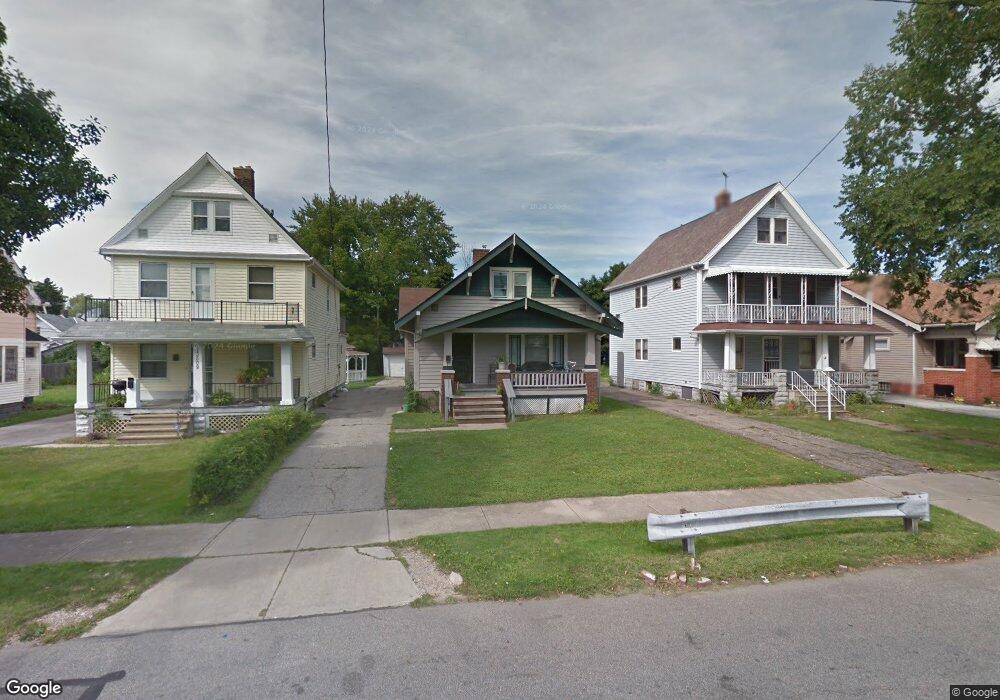
13513 Svec Ave Cleveland, OH 44120
Mount Pleasant NeighborhoodEstimated Value: $71,000 - $105,000
4
Beds
1
Bath
1,314
Sq Ft
$64/Sq Ft
Est. Value
About This Home
This home is located at 13513 Svec Ave, Cleveland, OH 44120 and is currently estimated at $84,366, approximately $64 per square foot. 13513 Svec Ave is a home located in Cuyahoga County.
Ownership History
Date
Name
Owned For
Owner Type
Purchase Details
Closed on
Apr 5, 2007
Sold by
Third Fsla Of Cleveland
Bought by
Floyd Hugh D
Current Estimated Value
Home Financials for this Owner
Home Financials are based on the most recent Mortgage that was taken out on this home.
Original Mortgage
$28,800
Interest Rate
6.2%
Mortgage Type
Purchase Money Mortgage
Purchase Details
Closed on
Nov 22, 2006
Sold by
Jones Theodore E
Bought by
Third Fsla Of Cleveland
Purchase Details
Closed on
Jul 19, 1995
Sold by
Eastburn Putnam Inc
Bought by
Jones Theodore E
Home Financials for this Owner
Home Financials are based on the most recent Mortgage that was taken out on this home.
Original Mortgage
$56,525
Interest Rate
7.5%
Mortgage Type
New Conventional
Purchase Details
Closed on
Feb 3, 1995
Sold by
Shrf Allen Rucker Pr
Bought by
Eastburn-Putnam Inc
Purchase Details
Closed on
Jan 1, 1975
Bought by
Bridges Lillian E
Create a Home Valuation Report for This Property
The Home Valuation Report is an in-depth analysis detailing your home's value as well as a comparison with similar homes in the area
Home Values in the Area
Average Home Value in this Area
Purchase History
| Date | Buyer | Sale Price | Title Company |
|---|---|---|---|
| Floyd Hugh D | $32,000 | Third Capital | |
| Third Fsla Of Cleveland | $36,667 | Attorneys Title Agency | |
| Jones Theodore E | $59,500 | -- | |
| Eastburn-Putnam Inc | $20,000 | -- | |
| Bridges Lillian E | -- | -- |
Source: Public Records
Mortgage History
| Date | Status | Borrower | Loan Amount |
|---|---|---|---|
| Previous Owner | Floyd Hugh D | $28,800 | |
| Previous Owner | Jones Theodore E | $56,525 |
Source: Public Records
Tax History
| Year | Tax Paid | Tax Assessment Tax Assessment Total Assessment is a certain percentage of the fair market value that is determined by local assessors to be the total taxable value of land and additions on the property. | Land | Improvement |
|---|---|---|---|---|
| 2025 | $1,150 | $17,185 | $3,850 | $13,335 |
| 2024 | $1,149 | $17,185 | $3,850 | $13,335 |
| 2023 | $725 | $9,350 | $2,700 | $6,650 |
| 2022 | $721 | $9,345 | $2,695 | $6,650 |
| 2021 | $714 | $9,350 | $2,700 | $6,650 |
| 2020 | $711 | $8,050 | $2,310 | $5,740 |
| 2019 | $659 | $23,000 | $6,600 | $16,400 |
| 2018 | $545 | $8,050 | $2,310 | $5,740 |
| 2017 | $438 | $5,180 | $2,170 | $3,010 |
| 2016 | $435 | $5,180 | $2,170 | $3,010 |
| 2015 | $436 | $5,180 | $2,170 | $3,010 |
| 2014 | $436 | $5,180 | $2,170 | $3,010 |
Source: Public Records
Map
Nearby Homes
- 13509 Svec Ave
- 13305 Svec Ave
- 13605 Melzer Ave
- 13617 Horner Ave
- 13811 Horner Ave
- 13200 Horner Ave
- 13201 Southview Ave
- 3840 E 142nd St
- 3651 E 140th St
- 13901 Chapelside Ave
- 3598 E 139th St
- 3648 E 129th St
- 3732 E 144th St
- 3677 E 143rd St
- 3731 E 144th St
- 3634 E 143rd St
- 3548 E 138th St
- 3565 E 139th St
- 13612 Durkee Ave
- 13302 Durkee Ave
- 13517 Svec Ave
- 13601 Svec Ave
- 13505 Svec Ave
- 13605 Svec Ave
- 13501 Svec Ave
- 13614 Bartlett Ave
- 13702 Bartlett Ave
- 13610 Bartlett Ave
- 13413 Svec Ave
- 13606 Bartlett Ave
- 13706 Bartlett Ave
- 13710 Bartlett Ave
- 13602 Bartlett Ave
- 13504 Svec Ave
- 13512 Svec Ave
- 13508 Svec Ave
- 13409 Svec Ave
- 13801 Svec Ave
- 13602 Svec Ave
- 13512 Bartlett Ave
Your Personal Tour Guide
Ask me questions while you tour the home.