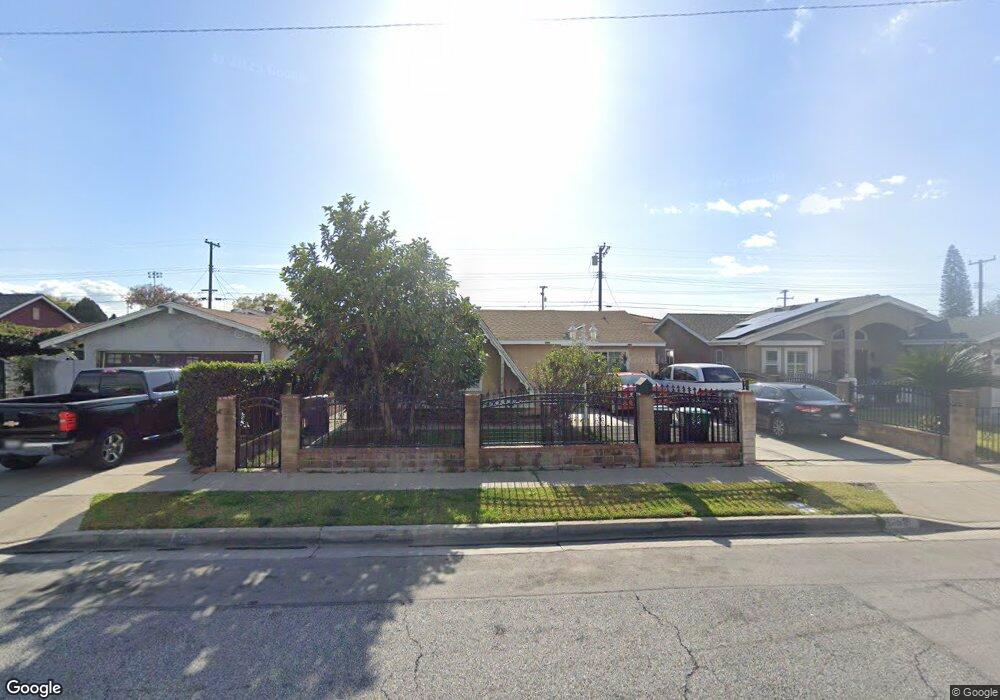
13518 Rockway Dr Baldwin Park, CA 91706
Estimated Value: $708,046 - $817,000
3
Beds
2
Baths
1,352
Sq Ft
$566/Sq Ft
Est. Value
About This Home
This home is located at 13518 Rockway Dr, Baldwin Park, CA 91706 and is currently estimated at $765,012, approximately $565 per square foot. 13518 Rockway Dr is a home located in Los Angeles County with nearby schools including Kenmore Elementary, Sierra Vista Middle School, and Sierra Vista High.
Ownership History
Date
Name
Owned For
Owner Type
Purchase Details
Closed on
Mar 12, 1996
Sold by
Castaneda Miguel
Bought by
Guivari Carlos P and Guivari Ramona
Current Estimated Value
Purchase Details
Closed on
Mar 6, 1995
Sold by
Arroyos Rick and Arroyos Evangeline
Bought by
Castaneda Miguel
Home Financials for this Owner
Home Financials are based on the most recent Mortgage that was taken out on this home.
Original Mortgage
$128,681
Interest Rate
8.32%
Mortgage Type
FHA
Purchase Details
Closed on
Feb 1, 1995
Sold by
Arroyos Evangeline T and Torres Enrique
Bought by
Arroyos Rick
Home Financials for this Owner
Home Financials are based on the most recent Mortgage that was taken out on this home.
Original Mortgage
$128,681
Interest Rate
8.32%
Mortgage Type
FHA
Purchase Details
Closed on
Aug 16, 1993
Sold by
Arroyos Evangeline T and Torres Evangeline
Bought by
Arroyos Evangeline T
Create a Home Valuation Report for This Property
The Home Valuation Report is an in-depth analysis detailing your home's value as well as a comparison with similar homes in the area
Home Values in the Area
Average Home Value in this Area
Purchase History
| Date | Buyer | Sale Price | Title Company |
|---|---|---|---|
| Guivari Carlos P | -- | -- | |
| Castaneda Miguel | $130,000 | Investors Title | |
| Arroyos Rick | -- | Investors Title Company | |
| Arroyos Rick | -- | Investors Title Company | |
| Arroyos Evangeline T | -- | Investors Title Company |
Source: Public Records
Mortgage History
| Date | Status | Borrower | Loan Amount |
|---|---|---|---|
| Previous Owner | Castaneda Miguel | $128,681 |
Source: Public Records
Tax History Compared to Growth
Tax History
| Year | Tax Paid | Tax Assessment Tax Assessment Total Assessment is a certain percentage of the fair market value that is determined by local assessors to be the total taxable value of land and additions on the property. | Land | Improvement |
|---|---|---|---|---|
| 2025 | $3,039 | $218,326 | $108,996 | $109,330 |
| 2024 | $3,039 | $214,046 | $106,859 | $107,187 |
| 2023 | $3,004 | $209,850 | $104,764 | $105,086 |
| 2022 | $3,049 | $205,736 | $102,710 | $103,026 |
| 2021 | $2,997 | $201,703 | $100,697 | $101,006 |
| 2019 | $2,824 | $195,722 | $97,711 | $98,011 |
| 2018 | $2,636 | $191,886 | $95,796 | $96,090 |
| 2016 | $2,472 | $184,436 | $92,077 | $92,359 |
| 2015 | $2,532 | $181,666 | $90,694 | $90,972 |
| 2014 | $2,500 | $178,108 | $88,918 | $89,190 |
Source: Public Records
Map
Nearby Homes
- 13655 Foster Ave Unit 2
- 3314 Baldwin Park Blvd
- 3843 Monterey Ave
- 13522 Francisquito Ave Unit C
- 13500 Ramona Pkwy
- 3537 Maine Ave
- 3151 Paddy Ln
- 3729 Baldwin Park Blvd
- 4008 Filhurst Ave
- 14043 Rockway Dr
- 13808 Ramona Pkwy
- 3902 Bresee Ave Unit 14
- 3902 Bresee Ave Unit 1
- 3060 Vineland Ave Unit 7
- 3000 Vineland Ave Unit 10
- 3355 Vineland Ave
- 3425 Athol St
- 3109 Robinette Ave
- 4000 Stewart Ave Unit 8
- 13120 Dart St Unit E
- 13524 Rockway Dr
- 13514 Rockway Dr
- 13530 Rockway Dr
- 13508 Rockway Dr
- 13519 Foster Ave
- 13534 Rockway Dr
- 13525 Foster Ave
- 13519 Rockway Dr
- 13525 Rockway Dr
- 13503 Foster Ave
- 13502 Rockway Dr
- 13515 Rockway Dr
- 13531 Foster Ave
- 13529 Rockway Dr
- 13509 Rockway Dr
- 13540 Rockway Dr
- 13501 Foster Ave
- 13454 Rockway Dr
- 13537 Foster Ave
- 13503 Rockway Dr