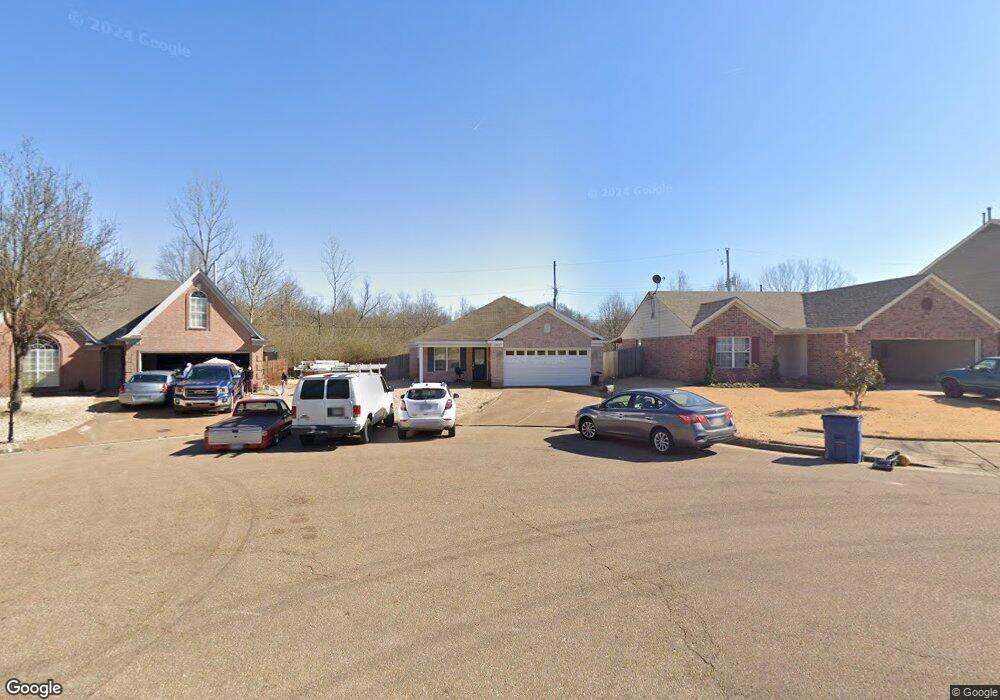
1352 Chatman Cove Cordova, TN 38018
Cordova NeighborhoodEstimated Value: $234,473 - $239,000
3
Beds
2
Baths
1,554
Sq Ft
$152/Sq Ft
Est. Value
About This Home
This home is located at 1352 Chatman Cove, Cordova, TN 38018 and is currently estimated at $236,868, approximately $152 per square foot. 1352 Chatman Cove is a home located in Shelby County with nearby schools including Dexter Elementary School, Dexter Middle School, and Cordova High School.
Ownership History
Date
Name
Owned For
Owner Type
Purchase Details
Closed on
Jul 17, 2006
Sold by
Gsell Thomas G
Bought by
Gsell Thomas G and Gsell Dorie L
Current Estimated Value
Purchase Details
Closed on
Nov 22, 2004
Sold by
Sovereign Bank
Bought by
Gsell Thomas G
Home Financials for this Owner
Home Financials are based on the most recent Mortgage that was taken out on this home.
Original Mortgage
$105,300
Outstanding Balance
$51,555
Interest Rate
5.6%
Mortgage Type
Unknown
Estimated Equity
$185,313
Purchase Details
Closed on
Apr 29, 2004
Sold by
Becton Richie and Becton Sonya
Bought by
Sovereign Bank
Purchase Details
Closed on
Sep 17, 2001
Sold by
Jac Co Construction Inc
Bought by
Becton Richie
Home Financials for this Owner
Home Financials are based on the most recent Mortgage that was taken out on this home.
Original Mortgage
$111,990
Interest Rate
6.89%
Mortgage Type
Balloon
Create a Home Valuation Report for This Property
The Home Valuation Report is an in-depth analysis detailing your home's value as well as a comparison with similar homes in the area
Home Values in the Area
Average Home Value in this Area
Purchase History
| Date | Buyer | Sale Price | Title Company |
|---|---|---|---|
| Gsell Thomas G | -- | Lenders Title & Escrow Llc | |
| Gsell Thomas G | $117,000 | -- | |
| Sovereign Bank | $105,200 | -- | |
| Becton Richie | $139,990 | -- | |
| Becton Richie | $139,990 | -- |
Source: Public Records
Mortgage History
| Date | Status | Borrower | Loan Amount |
|---|---|---|---|
| Open | Gsell Thomas G | $105,300 | |
| Previous Owner | Becton Richie | $111,990 | |
| Closed | Becton Richie | $27,980 |
Source: Public Records
Tax History Compared to Growth
Tax History
| Year | Tax Paid | Tax Assessment Tax Assessment Total Assessment is a certain percentage of the fair market value that is determined by local assessors to be the total taxable value of land and additions on the property. | Land | Improvement |
|---|---|---|---|---|
| 2025 | $1,418 | $64,875 | $8,750 | $56,125 |
| 2024 | $1,418 | $41,825 | $6,875 | $34,950 |
| 2023 | $1,418 | $41,825 | $6,875 | $34,950 |
| 2022 | $1,418 | $41,825 | $6,875 | $34,950 |
| 2021 | $1,443 | $41,825 | $6,875 | $34,950 |
| 2020 | $1,250 | $30,875 | $6,875 | $24,000 |
| 2019 | $1,250 | $30,875 | $6,875 | $24,000 |
| 2018 | $1,250 | $30,875 | $6,875 | $24,000 |
| 2017 | $1,269 | $30,875 | $6,875 | $24,000 |
| 2016 | $1,248 | $28,550 | $0 | $0 |
| 2014 | $1,248 | $28,550 | $0 | $0 |
Source: Public Records
Map
Nearby Homes
- 7194 Charlton Way
- 1382 Exbury Dr
- 7412 Lost Trail Dr
- 7426 Lost Trail Dr
- 7410 Appling Rain Dr
- 7407 Lost Grove Ln
- 7520 Crystal Lake Dr
- 7035 S Estacada Way
- 1321 Winter Springs Ln
- 1277 Winter Springs Ln
- 1520 Cider House Ln
- 1089 Links View Ln W
- 7468 Links View Ln S
- 1595 Dexter Grove Ct Unit E105
- 1595 Dexter Grove Ct Unit D101
- 7565 Wintergreen Ln
- 6916 Lagrange Pines Rd
- 7494 Links View Ln S
- 7646 Dexter Run Cir
- 6838 Lagrange Cir N
- 1348 Chatman Cove
- 1360 Chatman Cove
- 1342 Chatman Cove
- 1364 Chatman Cove
- 1338 Chatman Cove
- 1347 Chatman Cove
- 1353 Chatman Cove
- 1369 Chatman Cove
- 1332 Chatman Cove
- 1341 Chatman Cove
- 1357 Chatman Cove
- 1337 Chatman Cove
- 1326 Chatman Cove
- 1328 Chatman Cove
- 1331 Chatman Cove
- 1348 Hazel Crest Ln
- 1324 Chatman Cove
- 1344 Hazel Crest Ln
- 1327 Chatman Cove
- 1340 Hazel Crest Ln