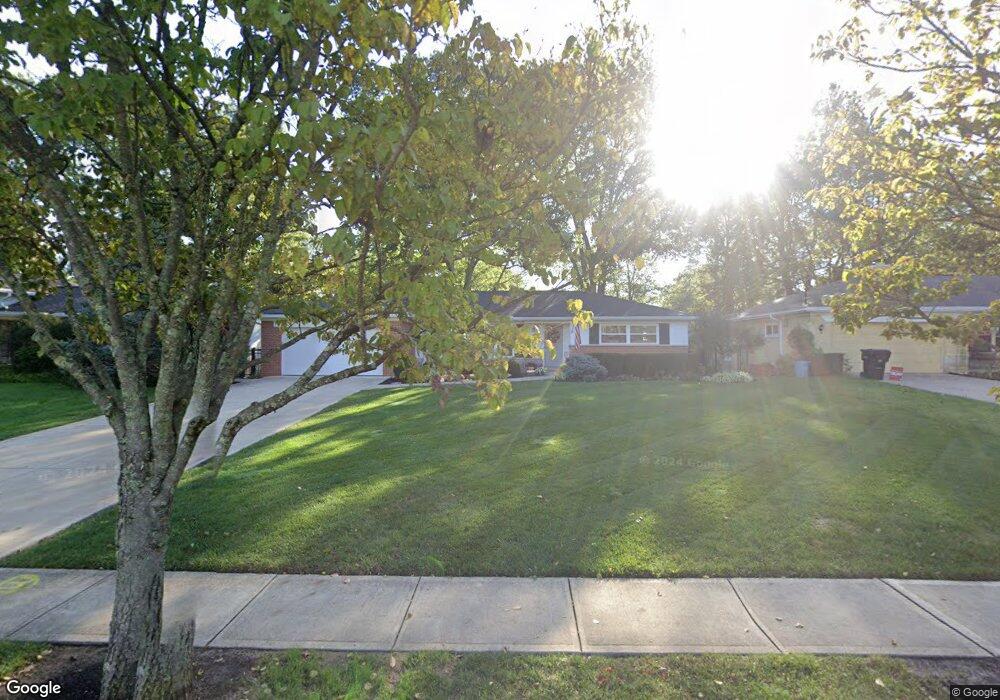
1352 Mayland Dr Cincinnati, OH 45230
Mount Washington NeighborhoodEstimated Value: $287,784 - $318,000
3
Beds
2
Baths
1,572
Sq Ft
$195/Sq Ft
Est. Value
About This Home
This home is located at 1352 Mayland Dr, Cincinnati, OH 45230 and is currently estimated at $306,696, approximately $195 per square foot. 1352 Mayland Dr is a home located in Hamilton County with nearby schools including Mt. Washington Elementary School, Clark Montessori High School, and Shroder High School.
Ownership History
Date
Name
Owned For
Owner Type
Purchase Details
Closed on
Feb 15, 2022
Sold by
Amk Mayland Llc
Bought by
Honerlaw Michael Stephen and Honerlaw Anne Marie
Current Estimated Value
Home Financials for this Owner
Home Financials are based on the most recent Mortgage that was taken out on this home.
Original Mortgage
$162,000
Outstanding Balance
$126,300
Interest Rate
2.93%
Mortgage Type
New Conventional
Estimated Equity
$180,396
Purchase Details
Closed on
Dec 10, 2014
Sold by
Schutte Catherine C
Bought by
Amk Mayland Llc
Purchase Details
Closed on
Jan 9, 2006
Sold by
Schutte Catherine C
Bought by
Schutte Catherine C and George H & Catherine C Schutte Family Li
Purchase Details
Closed on
Oct 30, 1995
Sold by
Schutte George H and Schutte Catherine C
Bought by
Schutte George H and Schutte Catherine C
Create a Home Valuation Report for This Property
The Home Valuation Report is an in-depth analysis detailing your home's value as well as a comparison with similar homes in the area
Home Values in the Area
Average Home Value in this Area
Purchase History
We collect this data history from publicly available records. To have your information removed, we recommend requesting removal directly through your county’s website.
| Date | Buyer | Sale Price | Title Company |
|---|---|---|---|
| Honerlaw Michael Stephen | -- | Northwest Title | |
| Amk Mayland Llc | $145,000 | Attorney | |
| Schutte Catherine C | -- | Attorney | |
| Schutte George H | -- | -- |
Source: Public Records
Mortgage History
We collect this data history from publicly available records. To have your information removed, we recommend requesting removal directly through your county’s website.
| Date | Status | Borrower | Loan Amount |
|---|---|---|---|
| Open | Honerlaw Michael Stephen | $162,000 |
Source: Public Records
Tax History
| Year | Tax Paid | Tax Assessment Tax Assessment Total Assessment is a certain percentage of the fair market value that is determined by local assessors to be the total taxable value of land and additions on the property. | Land | Improvement |
|---|---|---|---|---|
| 2025 | $4,901 | $79,388 | $10,784 | $68,604 |
| 2023 | $4,860 | $79,388 | $10,784 | $68,604 |
| 2022 | $4,094 | $57,859 | $9,079 | $48,780 |
| 2021 | $4,020 | $57,859 | $9,079 | $48,780 |
| 2020 | $4,031 | $57,859 | $9,079 | $48,780 |
| 2019 | $3,885 | $50,751 | $7,963 | $42,788 |
| 2018 | $3,888 | $50,751 | $7,963 | $42,788 |
| 2017 | $3,744 | $50,751 | $7,963 | $42,788 |
| 2016 | $3,946 | $52,178 | $9,100 | $43,078 |
| 2015 | $3,527 | $52,178 | $9,100 | $43,078 |
| 2014 | $2,803 | $52,178 | $9,100 | $43,078 |
| 2013 | $2,851 | $52,178 | $9,100 | $43,078 |
Source: Public Records
Map
Nearby Homes
- 1414 Beacon Rd
- 1244 Bondick Ct
- 6448 Craigland Ct
- 1546 Beacon St
- 6193 Dawes Ln
- a Salem Rd
- 1451 Sutton Ave
- 1647 Dell Terrace
- 1150 Brooke Ave
- 1149 Lanette Dr
- 1047 Beacon St
- 1415 Burney Ln
- 1508 Beth Ln
- 1 Salem Rd
- 1679 Brachman Ave
- 6148 Cambridge Ave
- 1109 Lanette Dr
- 1741 Mears Ave
- 1023 Nimitz Ln
- 3 Salem Rd
- 1364 Mayland Dr
- 1338 Mayland Dr
- 1378 Mayland Dr
- 1326 Mayland Dr
- 1379 Dyer Ave
- 1383 Dyer Ave
- 1375 Dyer Ave
- 1355 Mayland Dr
- 1391 Dyer Ave
- 1365 Mayland Dr
- 1390 Mayland Dr
- 1371 Dyer Ave
- 1375 Mayland Dr
- 1312 Mayland Dr
- 1327 Mayland Dr
- 1395 Dyer Ave
- 1367 Dyer Ave
- 1404 Mayland Dr
- 1401 Dyer Ave
- 1313 Mayland Dr
Your Personal Tour Guide
Ask me questions while you tour the home.