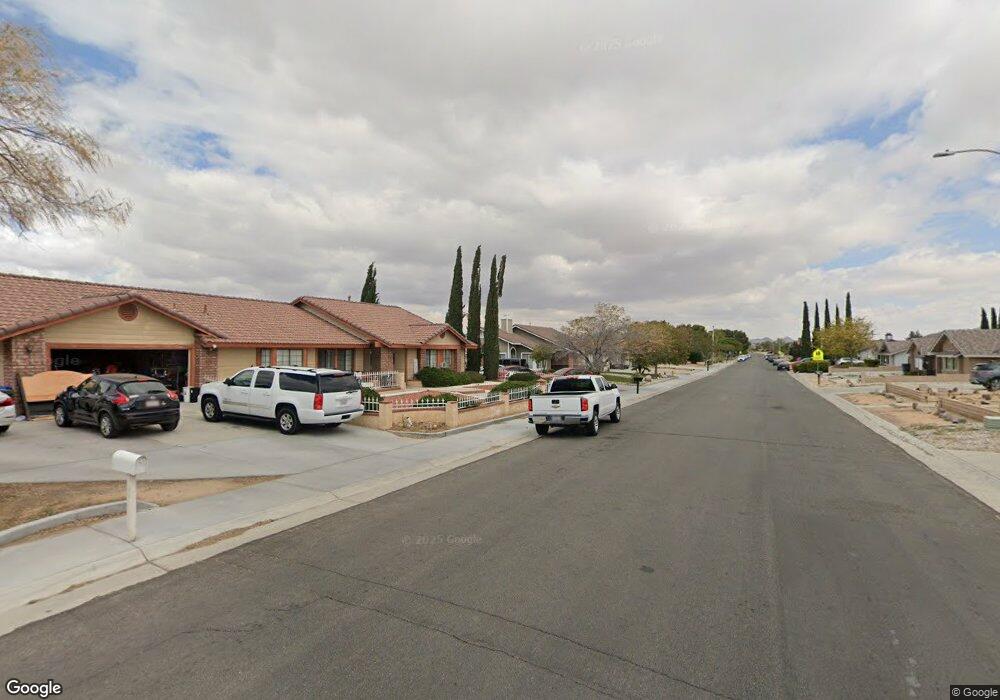
13520 Havasu Rd Apple Valley, CA 92308
High Desert NeighborhoodEstimated Value: $480,905 - $575,000
4
Beds
2
Baths
2,004
Sq Ft
$259/Sq Ft
Est. Value
About This Home
This home is located at 13520 Havasu Rd, Apple Valley, CA 92308 and is currently estimated at $519,726, approximately $259 per square foot. 13520 Havasu Rd is a home located in San Bernardino County with nearby schools including Rio Vista School of Applied Learning, Apple Valley High School, and Academy for Academic Excellence.
Ownership History
Date
Name
Owned For
Owner Type
Purchase Details
Closed on
Aug 2, 2014
Sold by
Byers John R
Bought by
The John & Christina Byers 2014 Trust
Current Estimated Value
Purchase Details
Closed on
Dec 4, 2001
Sold by
Boortz Frank G
Bought by
Byers John R and Byers Christina L
Home Financials for this Owner
Home Financials are based on the most recent Mortgage that was taken out on this home.
Original Mortgage
$115,200
Outstanding Balance
$45,916
Interest Rate
6.84%
Estimated Equity
$473,810
Purchase Details
Closed on
Aug 11, 1993
Sold by
High Country Development Co #2
Bought by
Boortz Frank G and Boortz Dolores A
Home Financials for this Owner
Home Financials are based on the most recent Mortgage that was taken out on this home.
Original Mortgage
$129,162
Interest Rate
6.97%
Mortgage Type
FHA
Create a Home Valuation Report for This Property
The Home Valuation Report is an in-depth analysis detailing your home's value as well as a comparison with similar homes in the area
Home Values in the Area
Average Home Value in this Area
Purchase History
| Date | Buyer | Sale Price | Title Company |
|---|---|---|---|
| The John & Christina Byers 2014 Trust | -- | None Available | |
| Byers John R | $144,000 | Stewart Title | |
| Boortz Frank G | $130,000 | First American Title Insuran |
Source: Public Records
Mortgage History
| Date | Status | Borrower | Loan Amount |
|---|---|---|---|
| Open | Byers John R | $115,200 | |
| Previous Owner | Boortz Frank G | $129,162 |
Source: Public Records
Tax History
| Year | Tax Paid | Tax Assessment Tax Assessment Total Assessment is a certain percentage of the fair market value that is determined by local assessors to be the total taxable value of land and additions on the property. | Land | Improvement |
|---|---|---|---|---|
| 2025 | $2,552 | $212,732 | $36,165 | $176,567 |
| 2024 | $2,481 | $208,561 | $35,456 | $173,105 |
| 2023 | $2,459 | $204,472 | $34,761 | $169,711 |
| 2022 | $2,422 | $200,462 | $34,079 | $166,383 |
| 2021 | $2,367 | $196,532 | $33,411 | $163,121 |
| 2020 | $2,339 | $194,516 | $33,068 | $161,448 |
| 2019 | $2,296 | $190,702 | $32,420 | $158,282 |
| 2018 | $2,240 | $186,962 | $31,784 | $155,178 |
| 2017 | $2,210 | $183,296 | $31,161 | $152,135 |
| 2016 | $2,115 | $179,702 | $30,550 | $149,152 |
| 2015 | $2,084 | $177,003 | $30,091 | $146,912 |
| 2014 | $2,056 | $173,536 | $29,502 | $144,034 |
Source: Public Records
Map
Nearby Homes
- 13436 Havasu Rd
- 18766 Kitom Rd
- 13250 Ivanpah Rd
- 13262 Cuyamaca Rd
- 19185 Cochise Place
- 13395 Driftwood Dr
- 18570 Niagara Dr
- 13380 Driftwood Dr
- 13501 Driftwood Dr
- 13535 Driftwood Dr
- 13185 Meteor Dr
- 19262 Monterey St
- 18475 Trout
- 12376 Kanbridge St
- 13195 Trailwood Way
- 13608 Sea Gull Dr
- 18891 Shoshonee Rd
- 13665 Driftwood Dr
- 13089 Bermuda Dunes Rd
- 19274 Kanbridge St
- 13536 Havasu Rd
- 13504 Havasu Rd
- 13584 Kurena Rd
- 13588 Kurena Rd
- 13550 Havasu Rd
- 13492 Havasu Rd
- 13576 Kurena Rd
- 13517 Havasu Rd
- 13531 Havasu Rd
- 13501 Havasu Rd
- 13547 Havasu Rd
- 13566 Havasu Rd
- 13478 Havasu Rd
- 13489 Havasu Rd
- 13561 Havasu Rd
- 13600 Kurena Rd
- 13464 Havasu Rd
- 13473 Havasu Rd
- 13585 Kurena Rd
- 13516 Ivanpah Rd
Your Personal Tour Guide
Ask me questions while you tour the home.