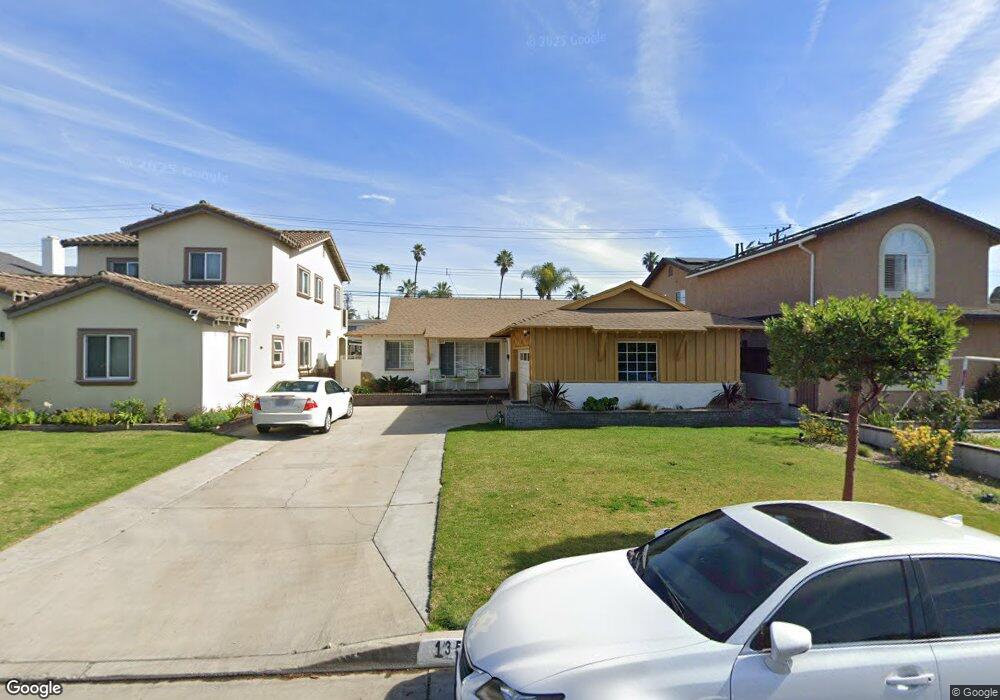
13522 Gunderson Ave Downey, CA 90242
Hollydale NeighborhoodEstimated Value: $778,000 - $846,000
3
Beds
2
Baths
1,505
Sq Ft
$539/Sq Ft
Est. Value
About This Home
This home is located at 13522 Gunderson Ave, Downey, CA 90242 and is currently estimated at $811,701, approximately $539 per square foot. 13522 Gunderson Ave is a home located in Los Angeles County with nearby schools including Ward Elementary School, Carpenter Elementary School, and Sussman Middle School.
Ownership History
Date
Name
Owned For
Owner Type
Purchase Details
Closed on
Oct 19, 2019
Sold by
Clayton Sharon Kay and Clayton Sharon
Bought by
Clayton Sharon Kay and The Sharon Kay Clayton Living Trust
Current Estimated Value
Purchase Details
Closed on
Jul 1, 2002
Sold by
Clipper Kenneth and Tinto Veronica
Bought by
Clayton Sharon
Home Financials for this Owner
Home Financials are based on the most recent Mortgage that was taken out on this home.
Original Mortgage
$216,600
Interest Rate
6.7%
Purchase Details
Closed on
Oct 27, 1999
Sold by
Trust Sanders Udell And Judy Trs Sanders
Bought by
Clipper Kenneth and Tinto Veronica
Home Financials for this Owner
Home Financials are based on the most recent Mortgage that was taken out on this home.
Original Mortgage
$203,324
Interest Rate
7.68%
Mortgage Type
FHA
Purchase Details
Closed on
Jul 31, 1993
Sold by
Sanders Udell R and Sanders Judith A
Bought by
Sanders Udell and Sanders Judy
Create a Home Valuation Report for This Property
The Home Valuation Report is an in-depth analysis detailing your home's value as well as a comparison with similar homes in the area
Home Values in the Area
Average Home Value in this Area
Purchase History
| Date | Buyer | Sale Price | Title Company |
|---|---|---|---|
| Clayton Sharon Kay | -- | None Available | |
| Clayton Sharon | $228,000 | Fidelity National Title Co | |
| Clipper Kenneth | $205,000 | Gateway Title Company | |
| Sanders Udell | -- | -- |
Source: Public Records
Mortgage History
| Date | Status | Borrower | Loan Amount |
|---|---|---|---|
| Previous Owner | Clayton Sharon | $216,600 | |
| Previous Owner | Clipper Kenneth | $203,324 |
Source: Public Records
Tax History Compared to Growth
Tax History
| Year | Tax Paid | Tax Assessment Tax Assessment Total Assessment is a certain percentage of the fair market value that is determined by local assessors to be the total taxable value of land and additions on the property. | Land | Improvement |
|---|---|---|---|---|
| 2025 | $4,310 | $330,196 | $187,113 | $143,083 |
| 2024 | $4,310 | $323,723 | $183,445 | $140,278 |
| 2023 | $4,168 | $317,377 | $179,849 | $137,528 |
| 2022 | $3,965 | $311,155 | $176,323 | $134,832 |
| 2021 | $3,867 | $305,055 | $172,866 | $132,189 |
| 2019 | $3,768 | $296,009 | $167,740 | $128,269 |
| 2018 | $3,601 | $290,205 | $164,451 | $125,754 |
| 2016 | $3,481 | $278,938 | $158,066 | $120,872 |
| 2015 | $3,431 | $274,749 | $155,692 | $119,057 |
| 2014 | $3,244 | $269,368 | $152,643 | $116,725 |
Source: Public Records
Map
Nearby Homes
- 13331 Blvd
- 13440 Lakewood Blvd Unit 97
- 13440 Lakewood Blvd Unit 98
- 13440 Lakewood Blvd Unit 99
- 8554 Elburg St Unit C
- 9130 Hargill St
- 13742 Hanwell Ave
- 8600 Contreras St Unit 68
- 8600 Contreras St Unit 27
- 8415 Elburg St
- 9226 Foster Rd
- 9244 Gardendale St
- 9225 Rosecrans Ave
- 8314 Somerset Ranch Rd Unit D
- 9229 Mandale St
- 14819 Downey Ave Unit 121
- 8356 Gardendale St
- 15000 Downey Ave Unit 273
- 15000 Downey Ave Unit 122
- 15000 Downey Ave Unit 343
- 13516 Gunderson Ave
- 13526 Gunderson Ave
- 13532 Gunderson Ave
- 13512 Gunderson Ave
- 13506 Gunderson Ave
- 13536 Gunderson Ave
- 13523 Gunderson Ave
- 13527 Gunderson Ave
- 13517 Gunderson Ave
- 13533 Gunderson Ave
- 13511 Gunderson Ave
- 13502 Gunderson Ave
- 13542 Gunderson Ave
- 13537 Gunderson Ave
- 13507 Gunderson Ave
- 8809 Rosecrans Ave
- 13543 Gunderson Ave
- 13454 Gunderson Ave
- 13550 Gunderson Ave
- 13522 Castana Ave