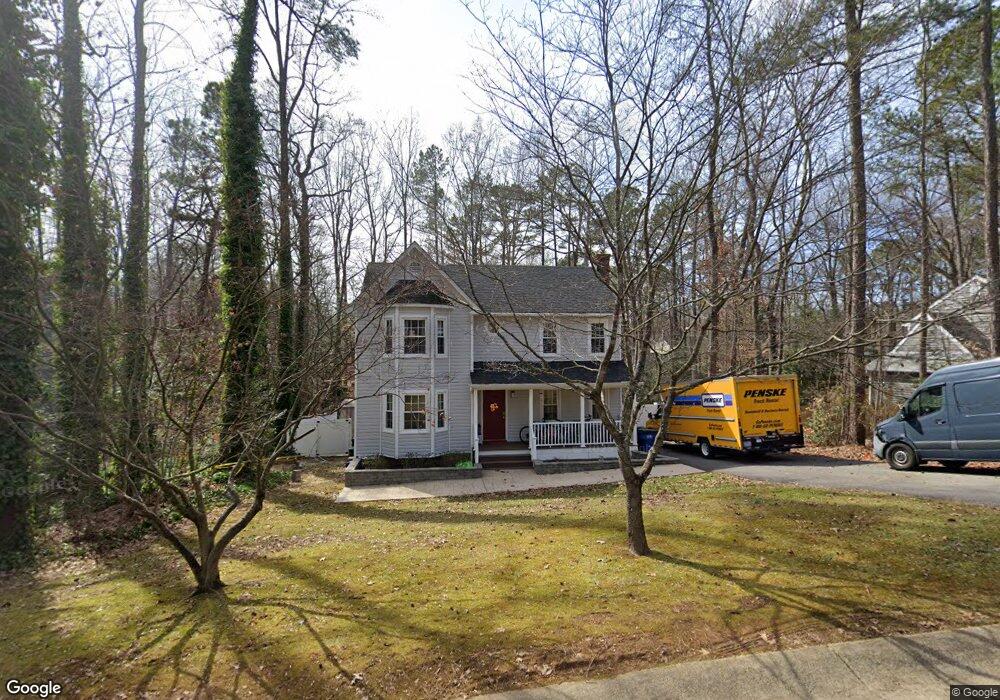
13525 Winning Colors Ln Midlothian, VA 23112
Estimated Value: $366,534 - $375,000
3
Beds
3
Baths
1,708
Sq Ft
$217/Sq Ft
Est. Value
About This Home
This home is located at 13525 Winning Colors Ln, Midlothian, VA 23112 and is currently estimated at $370,134, approximately $216 per square foot. 13525 Winning Colors Ln is a home located in Chesterfield County with nearby schools including Alberta Smith Elementary School, Bailey Bridge Middle School, and Manchester High.
Ownership History
Date
Name
Owned For
Owner Type
Purchase Details
Closed on
Jul 23, 2007
Sold by
Chen Wayne
Bought by
Chen Zane
Current Estimated Value
Home Financials for this Owner
Home Financials are based on the most recent Mortgage that was taken out on this home.
Original Mortgage
$234,500
Outstanding Balance
$146,876
Interest Rate
6.54%
Mortgage Type
New Conventional
Estimated Equity
$223,258
Purchase Details
Closed on
Sep 11, 2006
Sold by
Shows Joshua
Bought by
Chen Wayne and Mehna,Sheila
Home Financials for this Owner
Home Financials are based on the most recent Mortgage that was taken out on this home.
Original Mortgage
$172,000
Interest Rate
6.54%
Mortgage Type
New Conventional
Purchase Details
Closed on
May 3, 2002
Sold by
Shelton David J
Bought by
Shows Joshua F
Home Financials for this Owner
Home Financials are based on the most recent Mortgage that was taken out on this home.
Original Mortgage
$132,500
Interest Rate
7.13%
Mortgage Type
New Conventional
Create a Home Valuation Report for This Property
The Home Valuation Report is an in-depth analysis detailing your home's value as well as a comparison with similar homes in the area
Home Values in the Area
Average Home Value in this Area
Purchase History
| Date | Buyer | Sale Price | Title Company |
|---|---|---|---|
| Chen Zane | $234,500 | -- | |
| Chen Wayne | $215,000 | -- | |
| Shows Joshua F | $132,500 | -- |
Source: Public Records
Mortgage History
| Date | Status | Borrower | Loan Amount |
|---|---|---|---|
| Open | Shows Joshua F | $234,500 | |
| Previous Owner | Chen Wayne | $172,000 | |
| Previous Owner | Shows Joshua F | $132,500 |
Source: Public Records
Tax History Compared to Growth
Tax History
| Year | Tax Paid | Tax Assessment Tax Assessment Total Assessment is a certain percentage of the fair market value that is determined by local assessors to be the total taxable value of land and additions on the property. | Land | Improvement |
|---|---|---|---|---|
| 2025 | $2,845 | $316,900 | $62,000 | $254,900 |
| 2024 | $2,845 | $307,500 | $60,000 | $247,500 |
| 2023 | $2,644 | $290,600 | $57,000 | $233,600 |
| 2022 | $2,468 | $268,300 | $54,000 | $214,300 |
| 2021 | $2,271 | $232,100 | $52,000 | $180,100 |
| 2020 | $2,092 | $220,200 | $50,000 | $170,200 |
| 2019 | $1,973 | $207,700 | $48,000 | $159,700 |
| 2018 | $1,934 | $203,600 | $47,000 | $156,600 |
| 2017 | $1,846 | $192,300 | $44,000 | $148,300 |
| 2016 | $1,770 | $184,400 | $43,000 | $141,400 |
| 2015 | $1,711 | $175,600 | $42,000 | $133,600 |
| 2014 | $1,641 | $168,300 | $41,000 | $127,300 |
Source: Public Records
Map
Nearby Homes
- 7706 Northern Dancer Ct
- 13707 Swale Ln
- 13813 Kentucky Derby Place
- 7806 Belmont Stakes Dr
- 14206 Triple Crown Dr
- 7136 Velvet Antler Dr
- 7018 Spring Trace Terrace
- 14007 Palomino Way
- 13305 Pointer Ridge Terrace
- 13501 Buck Rub Dr
- 7112 Deer Thicket Dr
- 14319 Key Deer Dr
- 9400 Kinnerton Dr
- 13106 Beech Hill Dr
- 8518 Easton Ridge Place
- 14331 Old Bond St
- 14412 Mission Hills Loop
- 12841 Penny Ln
- 14261 Spyglass Hill Cir
- 12900 Craftsbury Ct
- 13519 Winning Colors Ln
- 7519 Secretariat Dr
- 7513 Secretariat Dr
- 13601 Winning Colors Ln
- 13524 Winning Colors Ln
- 13513 Winning Colors Ln
- 7525 Secretariat Dr
- 7507 Secretariat Dr
- 7510 Winning Colors Place
- 7531 Secretariat Dr
- 7506 Winning Colors Ct
- 13607 Winning Colors Ln
- 13507 Winning Colors Ln
- 7501 Secretariat Dr
- 7508 Winning Colors Place
- 7505 Winning Colors Ct
- 7537 Secretariat Dr
- 13612 Winning Colors Ln
- 7701 Northern Dancer Ct
- 7425 Secretariat Dr