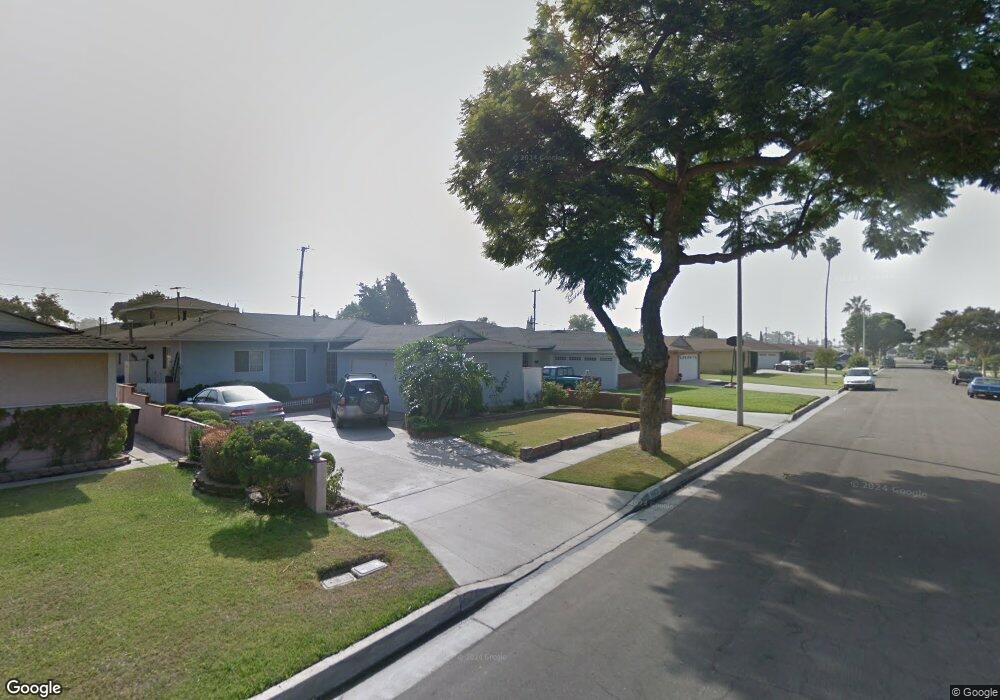
13528 Lancelot Ave Norwalk, CA 90650
Estimated Value: $754,847 - $788,000
3
Beds
2
Baths
1,200
Sq Ft
$647/Sq Ft
Est. Value
About This Home
This home is located at 13528 Lancelot Ave, Norwalk, CA 90650 and is currently estimated at $776,212, approximately $646 per square foot. 13528 Lancelot Ave is a home located in Los Angeles County with nearby schools including Thomas B. Moffitt Elementary School, Nettie L. Waite Middle School, and John H. Glenn High School.
Ownership History
Date
Name
Owned For
Owner Type
Purchase Details
Closed on
Jan 30, 2006
Sold by
Cano Lizbeth A
Bought by
Espinoza Gerardo and Cano Lizbeth A
Current Estimated Value
Home Financials for this Owner
Home Financials are based on the most recent Mortgage that was taken out on this home.
Original Mortgage
$257,000
Outstanding Balance
$9,183
Interest Rate
6.16%
Mortgage Type
New Conventional
Estimated Equity
$767,029
Purchase Details
Closed on
Mar 7, 2003
Sold by
Lee Yong Ho
Bought by
Cano Lizbeth A and Espinoza Gerardo
Home Financials for this Owner
Home Financials are based on the most recent Mortgage that was taken out on this home.
Original Mortgage
$203,200
Interest Rate
5.78%
Purchase Details
Closed on
Apr 22, 1998
Sold by
Lee Ezekiel H
Bought by
Lee Yong Ho
Create a Home Valuation Report for This Property
The Home Valuation Report is an in-depth analysis detailing your home's value as well as a comparison with similar homes in the area
Home Values in the Area
Average Home Value in this Area
Purchase History
| Date | Buyer | Sale Price | Title Company |
|---|---|---|---|
| Espinoza Gerardo | -- | Chicago Title Co | |
| Cano Lizbeth A | $254,000 | Landsafe Title | |
| Lee Yong Ho | -- | -- |
Source: Public Records
Mortgage History
| Date | Status | Borrower | Loan Amount |
|---|---|---|---|
| Open | Espinoza Gerardo | $257,000 | |
| Closed | Cano Lizbeth A | $203,200 | |
| Closed | Cano Lizbeth A | $38,100 |
Source: Public Records
Tax History Compared to Growth
Tax History
| Year | Tax Paid | Tax Assessment Tax Assessment Total Assessment is a certain percentage of the fair market value that is determined by local assessors to be the total taxable value of land and additions on the property. | Land | Improvement |
|---|---|---|---|---|
| 2025 | $4,927 | $367,851 | $265,755 | $102,096 |
| 2024 | $4,927 | $360,640 | $260,545 | $100,095 |
| 2023 | $4,764 | $353,570 | $255,437 | $98,133 |
| 2022 | $4,681 | $346,638 | $250,429 | $96,209 |
| 2021 | $4,616 | $339,842 | $245,519 | $94,323 |
| 2019 | $4,486 | $329,764 | $238,238 | $91,526 |
| 2018 | $4,287 | $323,299 | $233,567 | $89,732 |
| 2016 | $4,109 | $310,748 | $224,499 | $86,249 |
| 2015 | $4,073 | $306,081 | $221,127 | $84,954 |
| 2014 | $3,793 | $300,086 | $216,796 | $83,290 |
Source: Public Records
Map
Nearby Homes
- 12742 Dilworth St
- 13624 Greenstone Ave
- 12737 Rosecrans Ave Unit 71
- 12947 Foster Rd
- 12874 Sycamore Village Dr
- 12235 Pine St Unit 5
- 13071 Miller Ave
- 12161 Firestone Blvd
- 12209 Rosecrans Ave
- 13709 Clarkdale Ave Unit A
- 12012 Sproul St Unit 1/2
- 14516 Maryton Ave
- 14519 Dinard Ave
- 12344 Spry St
- 12020 Orange St Unit A
- 14923 Norwalk Blvd
- 14503 Elaine Ave
- 13213 Leffingwell Rd
- 15312 Roper Ave
- 12019 Busiris Ave
- 13522 Lancelot Ave
- 13602 Lancelot Ave
- 13535 Bechard Ave
- 13518 Lancelot Ave
- 13608 Lancelot Ave
- 13529 Bechard Ave
- 13541 Bechard Ave
- 13523 Bechard Ave
- 13545 Bechard Ave
- 13529 Lancelot Ave
- 13512 Lancelot Ave
- 13523 Lancelot Ave
- 13603 Lancelot Ave
- 13612 Lancelot Ave
- 13519 Lancelot Ave
- 13519 Bechard Ave
- 13609 Lancelot Ave
- 13551 Bechard Ave
- 13506 Lancelot Ave
- 13513 Lancelot Ave