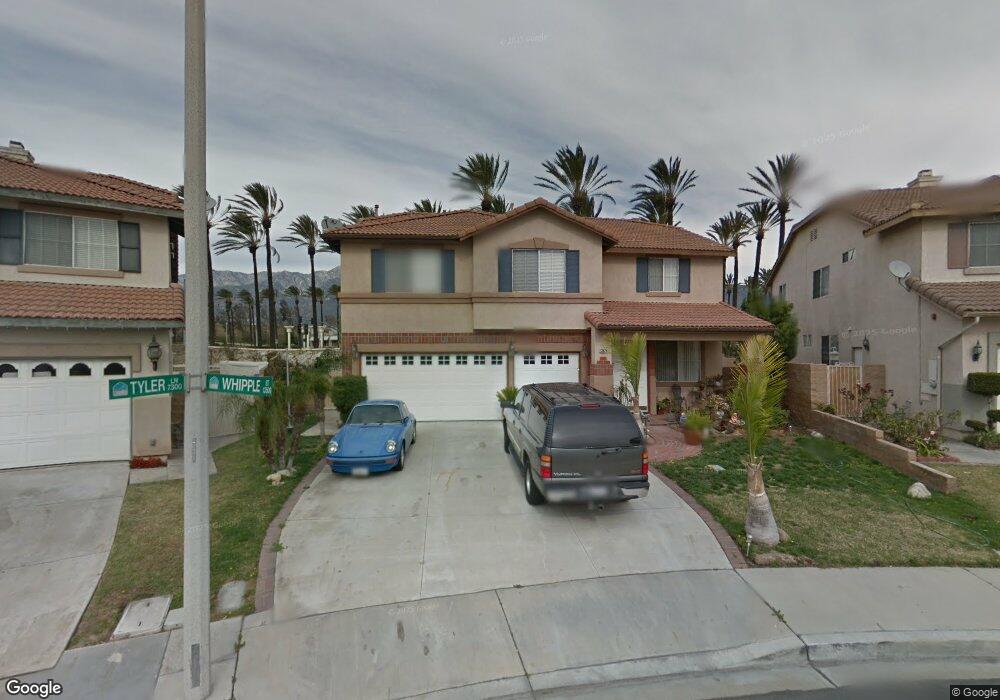
13528 Whipple St Fontana, CA 92336
West End NeighborhoodEstimated Value: $835,000 - $875,000
4
Beds
3
Baths
2,992
Sq Ft
$285/Sq Ft
Est. Value
About This Home
This home is located at 13528 Whipple St, Fontana, CA 92336 and is currently estimated at $853,737, approximately $285 per square foot. 13528 Whipple St is a home located in San Bernardino County with nearby schools including East Heritage Elementary School, Heritage Intermediate School, and Etiwanda High.
Ownership History
Date
Name
Owned For
Owner Type
Purchase Details
Closed on
Jul 25, 2011
Sold by
Chan Danny S
Bought by
Men Sophone R
Current Estimated Value
Home Financials for this Owner
Home Financials are based on the most recent Mortgage that was taken out on this home.
Original Mortgage
$237,000
Outstanding Balance
$162,664
Interest Rate
4.46%
Mortgage Type
New Conventional
Estimated Equity
$691,073
Purchase Details
Closed on
May 18, 2011
Sold by
Colbert Avis D
Bought by
Colbert William and Colbert Avis D
Purchase Details
Closed on
Nov 17, 2003
Sold by
Colbert William and Colbert Avis D
Bought by
Colbert Avis D
Purchase Details
Closed on
Sep 29, 1999
Sold by
Kaufman & Broad Of Southern Ca Inc
Bought by
Colbert William and Colbert Avis D
Home Financials for this Owner
Home Financials are based on the most recent Mortgage that was taken out on this home.
Original Mortgage
$166,680
Interest Rate
8.95%
Create a Home Valuation Report for This Property
The Home Valuation Report is an in-depth analysis detailing your home's value as well as a comparison with similar homes in the area
Home Values in the Area
Average Home Value in this Area
Purchase History
| Date | Buyer | Sale Price | Title Company |
|---|---|---|---|
| Men Sophone R | -- | Chicago Title Inland Empire | |
| Men Sophone R | $300,000 | Chicago Title Inland Empire | |
| Colbert William | -- | Chicago Title Inland Empire | |
| Colbert Avis D | -- | -- | |
| Colbert William | $208,500 | First American Title Ins Co |
Source: Public Records
Mortgage History
| Date | Status | Borrower | Loan Amount |
|---|---|---|---|
| Open | Men Sophone R | $237,000 | |
| Previous Owner | Colbert William | $166,680 | |
| Closed | Colbert William | $41,670 |
Source: Public Records
Tax History Compared to Growth
Tax History
| Year | Tax Paid | Tax Assessment Tax Assessment Total Assessment is a certain percentage of the fair market value that is determined by local assessors to be the total taxable value of land and additions on the property. | Land | Improvement |
|---|---|---|---|---|
| 2025 | $5,837 | $376,816 | $94,203 | $282,613 |
| 2024 | $5,837 | $369,428 | $92,356 | $277,072 |
| 2023 | $5,268 | $362,184 | $90,545 | $271,639 |
| 2022 | $5,202 | $355,083 | $88,770 | $266,313 |
| 2021 | $5,119 | $348,120 | $87,029 | $261,091 |
| 2020 | $5,486 | $344,551 | $86,137 | $258,414 |
| 2019 | $5,380 | $337,795 | $84,448 | $253,347 |
| 2018 | $5,354 | $331,171 | $82,792 | $248,379 |
| 2017 | $5,373 | $324,678 | $81,169 | $243,509 |
| 2016 | $5,238 | $318,311 | $79,577 | $238,734 |
| 2015 | $5,186 | $313,530 | $78,382 | $235,148 |
| 2014 | $5,045 | $307,389 | $76,847 | $230,542 |
Source: Public Records
Map
Nearby Homes
- 7543 W Liberty Pkwy Unit 711
- 7397 Mcclellan Ct
- 7161 East Ave Unit 4
- 13414 Columbus Ct
- 13212 Woodchase Ct
- 13564 Williamson Rd
- 7245 Bodega St
- 7044 Mallow Dr Unit 4
- 13667 Victoria St
- 7331 Shelby Place Unit 8
- 7331 Shelby Place Unit 91
- 13152 River Oaks Dr
- 6956 Mallow Dr
- Plan 2 at Aurora Park - Goldenrod
- 13643 Cabrillo Ct
- 13422 Banning St
- 7638 Tuscany Place
- 13877 Gazania Ln
- 6318 Echo Mountain
- 13042 Larrera St
- 13524 Whipple St
- 13536 Whipple St
- 13544 Whipple St
- 7346 Tyler Ln
- 7354 Tyler Ln
- 13552 Whipple St
- 13547 Whipple St
- 7362 Tyler Ln
- 13560 Whipple St
- 13555 Whipple St
- 13536 Burnside Place
- 7370 Tyler Ln
- 13563 Whipple St
- 13544 Burnside Place
- 13568 Whipple St
- 13552 Burnside Place
- 7378 Tyler Ln
- 13571 Whipple St
- 13576 Whipple St
- 13560 Burnside Place