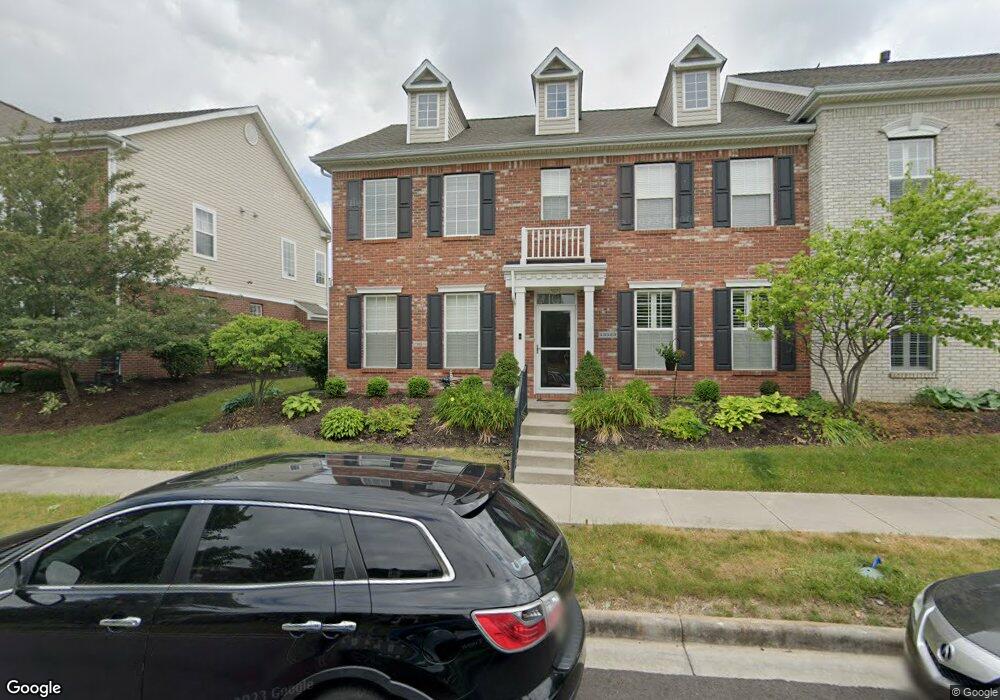
13529 Molique Blvd Unit 1001 Fishers, IN 46037
Estimated Value: $327,000 - $342,000
3
Beds
3
Baths
2,140
Sq Ft
$155/Sq Ft
Est. Value
About This Home
This home is located at 13529 Molique Blvd Unit 1001, Fishers, IN 46037 and is currently estimated at $332,496, approximately $155 per square foot. 13529 Molique Blvd Unit 1001 is a home located in Hamilton County with nearby schools including Overland Park Elementary School, Thorpe Creek Elementary School, and Hamilton Southeastern Intermediate / Junior High.
Ownership History
Date
Name
Owned For
Owner Type
Purchase Details
Closed on
Aug 27, 2018
Sold by
Gloyeske Nika C
Bought by
Hoffman Ronald W and Hoffman Susanne E
Current Estimated Value
Purchase Details
Closed on
Jun 18, 2013
Sold by
Pacheco Fred R and Pacheco Della K
Bought by
Gloyeske Nika C
Home Financials for this Owner
Home Financials are based on the most recent Mortgage that was taken out on this home.
Original Mortgage
$188,000
Interest Rate
3.43%
Mortgage Type
New Conventional
Purchase Details
Closed on
Oct 25, 2005
Sold by
Portrait Homes Hannover On The Green Llc
Bought by
Pacheco Fred R and Pacheco Della K
Home Financials for this Owner
Home Financials are based on the most recent Mortgage that was taken out on this home.
Original Mortgage
$192,940
Interest Rate
5.98%
Mortgage Type
Fannie Mae Freddie Mac
Create a Home Valuation Report for This Property
The Home Valuation Report is an in-depth analysis detailing your home's value as well as a comparison with similar homes in the area
Home Values in the Area
Average Home Value in this Area
Purchase History
| Date | Buyer | Sale Price | Title Company |
|---|---|---|---|
| Hoffman Ronald W | -- | None Available | |
| Gloyeske Nika C | -- | None Available | |
| Pacheco Fred R | -- | Ctic Statesmen |
Source: Public Records
Mortgage History
| Date | Status | Borrower | Loan Amount |
|---|---|---|---|
| Previous Owner | Gloyeske Nika C | $188,000 | |
| Previous Owner | Pacheco Fred R | $192,940 |
Source: Public Records
Tax History Compared to Growth
Tax History
| Year | Tax Paid | Tax Assessment Tax Assessment Total Assessment is a certain percentage of the fair market value that is determined by local assessors to be the total taxable value of land and additions on the property. | Land | Improvement |
|---|---|---|---|---|
| 2024 | $2,964 | $285,500 | $42,800 | $242,700 |
| 2022 | $2,964 | $258,100 | $42,800 | $215,300 |
| 2021 | $2,858 | $240,700 | $42,800 | $197,900 |
| 2020 | $2,633 | $219,300 | $42,800 | $176,500 |
| 2019 | $2,543 | $212,500 | $37,000 | $175,500 |
| 2018 | $2,346 | $203,900 | $37,000 | $166,900 |
| 2017 | $2,290 | $201,900 | $37,000 | $164,900 |
| 2016 | $2,225 | $198,400 | $37,000 | $161,400 |
| 2014 | $2,054 | $197,700 | $43,100 | $154,600 |
| 2013 | $2,054 | $188,600 | $43,100 | $145,500 |
Source: Public Records
Map
Nearby Homes
- 13172 Saxony Blvd
- 13484 Molique Blvd
- 13330 Saxony Blvd W
- 13301 Minden Dr
- 13616 Whitten Dr N
- 13423 E 134th St
- 13311 Susser Way
- 12985 Saxony Blvd
- 13288 E Lieder Way
- 13276 E Lieder Way
- 13008 Overview Dr
- 12964 Walbeck Dr
- 13935 Canonbury Way
- 13315 Patriotic Way
- 12957 E 131st St
- 12880 Oxbridge Place
- 12890 Old Glory Dr
- 12997 Bartlett Dr
- 12994 Dekoven Dr
- 14110 Bay Willow Dr
- 13529 Molique Blvd
- 13529 Molique Blvd Unit 201001
- 13523 Molique Blvd
- 13535 Molique Blvd
- 13535 Molique Blvd Unit 904
- 13517 Molique Blvd
- 13517 Molique Blvd Unit 10
- 13541 Molique Blvd
- 13541 Molique Blvd Unit 903
- 13528 E 131st St Unit 13
- 13547 Molique Blvd
- 13522 E 131st St
- 13516 E 131st St
- 13516 E 131st St Unit 1301
- 13540 E 131st St
- 13505 Molique Blvd
- 13553 Molique Blvd
- 13553 Molique Blvd Unit 901
- 13510 E 131st St
- 13510 E 131st St Unit 1405